CSS01 Network Analysis#
Intro to network analysis in python by Trenton McKinney (Recommended!)
Network analysis for liquistics by AlvinChen (Good!)
igraph with python by Alvin Chen (Good!)
Text network analysis towarddatascience (Good!)
Building Network#
# colab
import pickle
!wget https://github.com/P4CSS/PSS/raw/master/data/pttpost_20210509_n178.dat -O pttpost_20210509_n178.dat
with open("pttpost_20210509_n178.dat", "rb") as fin:
    all_post = pickle.load(fin)
--2025-09-21 21:59:29--  https://github.com/P4CSS/PSS/raw/master/data/pttpost_20210509_n178.dat
Resolving github.com (github.com)... 20.27.177.113
Connecting to github.com (github.com)|20.27.177.113|:443...
connected.
HTTP request sent, awaiting response...
302 Found
Location: https://raw.githubusercontent.com/P4CSS/PSS/master/data/pttpost_20210509_n178.dat [following]
--2025-09-21 21:59:29--  https://raw.githubusercontent.com/P4CSS/PSS/master/data/pttpost_20210509_n178.dat
Resolving raw.githubusercontent.com (raw.githubusercontent.com)... 185.199.109.133, 185.199.110.133, 185.199.111.133, ...
Connecting to raw.githubusercontent.com (raw.githubusercontent.com)|185.199.109.133|:443...
connected.
HTTP request sent, awaiting response...
200 OK
Length: 992132 (969K) [application/octet-stream]
Saving to: 'pttpost_20210509_n178.dat'


          pttpost_2   0%[                    ]       0  --.-KB/s
pttpost_20 0%[ ] 9.42K 13.4KB/s
pttpost_202 3%[ ] 36.16K 39.1KB/s
pttpost_2021 5%[> ] 54.63K 37.6KB/s
pttpost_20210 10%[=> ] 102.63K 50.1KB/s
pttpost_202105 11%[=> ] 110.63K 36.9KB/s eta 23s
pttpost_2021050 12%[=> ] 118.63K 35.1KB/s eta 23s
pttpost_20210509 13%[=> ] 134.63K 31.2KB/s eta 27s
pttpost_20210509_ 15%[==> ] 150.63K 32.2KB/s eta 27s
pttpost_20210509_n 16%[==> ] 158.63K 28.2KB/s eta 29s
pttpost_20210509_n1 18%[==> ] 174.63K 25.8KB/s eta 31s
ttpost_20210509_n17 18%[==> ] 182.63K 25.1KB/s eta 31s
tpost_20210509_n178 20%[===> ] 198.63K 24.9KB/s eta 31s
post_20210509_n178. 21%[===> ] 206.63K 23.1KB/s eta 31s
ost_20210509_n178.d 22%[===> ] 214.63K 23.0KB/s eta 33s
st_20210509_n178.da 22%[===> ] 222.63K 21.7KB/s eta 33s
t_20210509_n178.dat 23%[===> ] 230.63K 21.5KB/s eta 34s
_20210509_n178.dat 24%[===> ] 238.63K 20.5KB/s eta 34s
20210509_n178.dat 25%[====> ] 246.63K 20.5KB/s eta 35s
0210509_n178.dat 26%[====> ] 254.63K 19.6KB/s eta 35s
210509_n178.dat 27%[====> ] 262.63K 19.9KB/s eta 36s
10509_n178.dat 27%[====> ] 270.63K 19.1KB/s eta 36s
0509_n178.dat 27%[====> ] 270.63K 17.9KB/s eta 39s
509_n178.dat 28%[====> ] 278.63K 18.1KB/s eta 39s
09_n178.dat 29%[====> ] 286.63K 17.5KB/s eta 39s
9_n178.dat 30%[=====> ] 294.63K 17.7KB/s eta 39s
_n178.dat 31%[=====> ] 302.63K 17.2KB/s eta 39s
n178.dat 32%[=====> ] 310.63K 17.4KB/s eta 39s
178.dat 32%[=====> ] 318.63K 16.9KB/s eta 38s
78.dat 34%[=====> ] 334.63K 16.8KB/s eta 38s
8.dat 34%[=====> ] 334.63K 16.0KB/s eta 38s
.dat 35%[======> ] 342.63K 16.2KB/s eta 39s
dat 37%[======> ] 366.63K 16.6KB/s eta 39s
at 38%[======> ] 374.63K 16.7KB/s eta 36s
t 39%[======> ] 382.63K 16.4KB/s eta 36s
40%[=======> ] 390.63K 16.6KB/s eta 35s
p 41%[=======> ] 398.63K 16.3KB/s eta 35s
^C
---------------------------------------------------------------------------
UnpicklingError                           Traceback (most recent call last)
Input In [1], in <cell line: 4>()
      3 get_ipython().system('wget https://github.com/P4CSS/PSS/raw/master/data/pttpost_20210509_n178.dat -O pttpost_20210509_n178.dat')
      4 with open("pttpost_20210509_n178.dat", "rb") as fin:
----> 5     all_post = pickle.load(fin)

UnpicklingError: pickle data was truncated
Collocation as Cooccurrence#
from collections import Counter
user_pair_counts = Counter()
len(all_post)
for post in all_post:
    for i, c1 in enumerate(post['comments']):
        for j, c2 in enumerate(post['comments']):
            if j >= 0 and j != i and j > i-5 and j < i+5 :
                u1, u2 = c1['userid'], c2['userid']
                if u1 != u2:
                    user_pair_counts[(u1, u2)] += 1

for pair, c in user_pair_counts.most_common(10):
    print("%s\t%s\t%d" % (pair[0], pair[1], c))
Runna	iampig951753	32
iampig951753	Runna	32
psl7634	gustavek	21
gustavek	psl7634	21
sl11pman	cwh0105	16
cwh0105	sl11pman	16
username1	l88	15
l88	username1	15
AIronKuma	lagadidi	14
lagadidi	AIronKuma	14
li = [(u1, u2, n)for (u1, u2), n in user_pair_counts.most_common() if n > 3]
df = pd.DataFrame.from_records(li, columns =['u1', 'u2', 'n'])
df
| u1 | u2 | n | |
|---|---|---|---|
| 0 | Runna | iampig951753 | 32 |
| 1 | iampig951753 | Runna | 32 |
| 2 | psl7634 | gustavek | 21 |
| 3 | gustavek | psl7634 | 21 |
| 4 | sl11pman | cwh0105 | 16 |
| ... | ... | ... | ... |
| 667 | kingstongyu | cecille | 4 |
| 668 | kingstongyu | kid1a2b3c4d | 4 |
| 669 | kid1a2b3c4d | kingstongyu | 4 |
| 670 | kid1a2b3c4d | kuan12065 | 4 |
| 671 | kuan12065 | kid1a2b3c4d | 4 |
672 rows × 3 columns
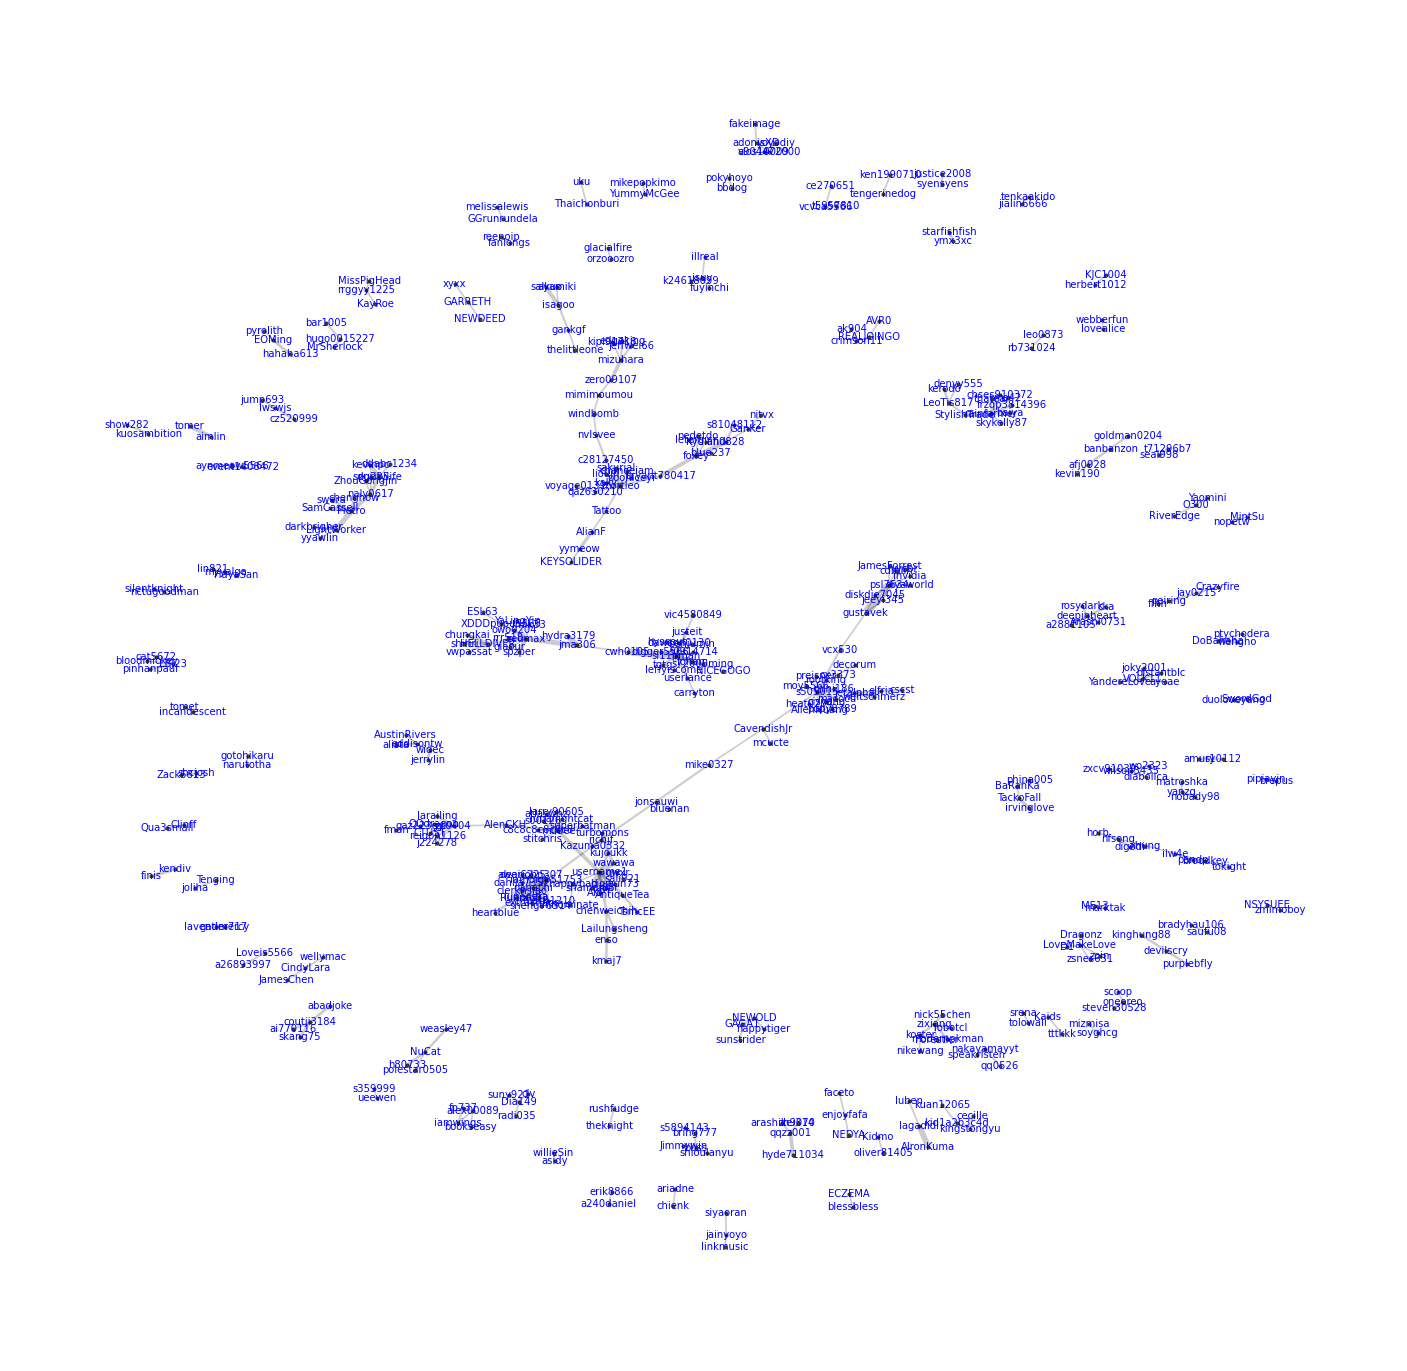
Drawing network#
matplotlib & networkx#
import matplotlib.pyplot as plt

import networkx as nx

fig = plt.figure(1, figsize=(30, 30), dpi=60)

G = nx.from_pandas_edgelist(df,
                            source = 'u1',
                            target = 'u2',
                            edge_attr = 'n')

widths = nx.get_edge_attributes(G, 'n')
nodelist = G.nodes()
# nx.draw_kamada_kawai(G,
#                     node_size = 5,
#                     edge_color = "#8833FF",
#                     with_labels = True)

pos = nx.spring_layout(G)
# nx.draw_spring(G,
#                node_size = 5,
#                edge_color = "#8833FF",
#                font_size = 16,
#                with_labels = True)

nx.draw_networkx_nodes(G, pos,
                       nodelist=nodelist,
                       node_size=15,
                       node_color='black',
                       alpha=0.7)

nx.draw_networkx_edges(G,pos,
                       edgelist = widths.keys(),
                       width=list([w/2 for w in widths.values()]),
                       edge_color='black',
                       alpha=0.2)

nx.draw_networkx_labels(G, pos=pos,
                        labels=dict(zip(nodelist,nodelist)),
                        font_color='blue')
plt.box(False)
plt.show()
pyvis.network#
from pyvis.network import Network
net = Network('1024px', '2048px', notebook=True)
net.from_nx(G)
net.show("test.html")
Local cdn resources have problems on chrome/safari when used in jupyter-notebook.
Node-level analysis#
Reference
# !pip install networkx
# !pip install nxviz

import networkx as nx
import nxviz as nv
import matplotlib as mpl
import matplotlib.pyplot as plt

print(f'NetworkX version: {nx.__version__}')
print(f'Matplotlib version: {mpl.__version__}')
# print(f'NXViz version: {nv.__version__}')
NetworkX version: 2.7.1
Matplotlib version: 3.5.1
print(len(G.edges()))
print(len(G.nodes()))
336
410
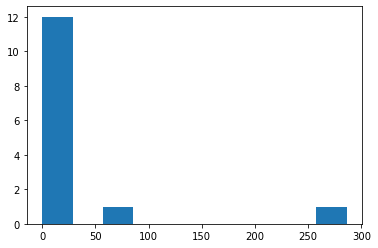
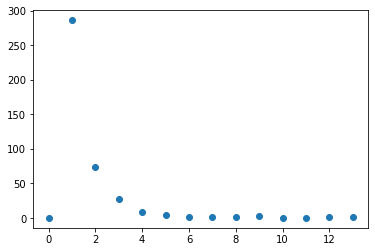
Degree histogram#
dhist = nx.degree_histogram(G)
dhist
[0, 286, 74, 27, 8, 4, 1, 2, 1, 3, 0, 0, 2, 2]
plt.figure()
plt.hist(dhist)
plt.show()

plt.figure()
plt.scatter(range(0, len(dhist)), dhist)
plt.show()
Degree centrality#
dc = nx.degree_centrality(G)
bc = nx.betweenness_centrality(G)
cc = nx.closeness_centrality(G)

c_df = pd.DataFrame([(k, v, bc[k], cc[k]) for k, v in dc.items()], columns=["name", "degreeC", "betweenC", "closeC"])
c_df.sort_values("degreeC", ascending=False)
| name | degreeC | betweenC | closeC | |
|---|---|---|---|---|
| 56 | s505015 | 0.031785 | 0.019452 | 0.033651 |
| 1 | iampig951753 | 0.031785 | 0.024348 | 0.044203 |
| 4 | sl11pman | 0.029340 | 0.003715 | 0.028211 |
| 6 | username1 | 0.029340 | 0.022382 | 0.041179 |
| 16 | zeumax | 0.022005 | 0.003296 | 0.026512 |
| ... | ... | ... | ... | ... |
| 187 | goldman0204 | 0.002445 | 0.000000 | 0.003667 |
| 184 | MrSherlock | 0.002445 | 0.000000 | 0.003260 |
| 181 | awei6225 | 0.002445 | 0.000000 | 0.036138 |
| 179 | popy8789 | 0.002445 | 0.000000 | 0.028765 |
| 409 | kuan12065 | 0.002445 | 0.000000 | 0.003667 |
410 rows × 4 columns
Global network analysis#
nx.density(G)
0.004007394597173356
nx.number_connected_components(G)
89
max_component = sorted(nx.connected_components(G), key=len, reverse=True)[0]
max_subgraph = G.subgraph(max_component)
print(f"radius: {nx.radius(max_subgraph)}")
print(f"diameter: {nx.diameter(max_subgraph)}")
print(f"eccentricity: {nx.eccentricity(max_subgraph)}")
print(f"center: {nx.center(max_subgraph)}")
print(f"periphery: {nx.periphery(max_subgraph)}")
print(f"density: {nx.density(max_subgraph)}")
radius: 8
diameter: 16
eccentricity: {'fman': 16, 'stja': 10, 'superbatman': 13, 'AKPT': 12, 'jonsauwi': 9, 'larailing': 15, 'preisner': 13, 'turbomons': 13, 'wawawa': 12, 'diyaworld': 16, 'elfria': 14, 'username1': 11, 'bluenan': 10, 'iampig951753': 9, 'extrachaos': 10, 'mudee': 12, 'sali921': 12, 'rootking': 13, 'heat0204': 13, 'AntiqueTea': 12, 'Runna': 10, 'moy5566': 13, 'cx3373': 13, 'JamesForrest': 16, 'Kazuma0332': 9, 'cdmlin': 16, 'dahlia7357': 10, 'gustavek': 14, 'atlaswhz': 13, 'AlenCKH': 13, 'stitchris': 13, 'popy8789': 13, 'lunenera': 10, 'cisyong': 13, 'awei6225': 10, 'happybad': 10, 'gt0404': 14, 'chenweichih': 12, 'mike0327': 10, 'qwxr': 12, 'cscst': 15, 'psl7634': 15, 'AllenHuang': 13, 'diskdie7045': 15, 'CavendishJr': 11, 'TsmcEE': 13, 'CTUST': 15, 'weltschmerz': 14, 'larry90605': 13, 'reigon1126': 15, 'nanachi': 10, 'j224278': 15, 'kmaj7': 14, 'c8c8c8c8c8c8': 13, 'QQdragon': 15, 'jeeyi345': 15, 'mcucte': 12, 'mach1210': 10, 'dearjohn307': 10, 'yycbr': 16, 'heartblue': 11, 'macocu': 13, 'vcx530': 13, 'lunanightcat': 13, 'mini186': 13, 'bigwun73': 12, 'enso': 13, 'shamanlin': 12, 's00126': 13, 'qaz223gy': 15, 'l88': 12, 'decorum': 14, 'clerkhsiao': 10, 'invidia': 16, 'innominate': 11, 'richjf': 8, 'sheng76314': 10, 'Lailungsheng': 13, 'jetalpha': 13, 's505015': 12, 'kujoukk': 12}
center: ['richjf']
periphery: ['fman', 'diyaworld', 'JamesForrest', 'cdmlin', 'yycbr', 'invidia']
density: 0.026851851851851852
Components#
" ".join([str(len(conn)) for conn in sorted(nx.connected_components(G), key=len, reverse=True)])
'81 31 31 13 11 8 7 5 5 5 5 5 5 4 4 4 4 4 4 4 4 4 4 4 4 4 4 3 3 3 3 3 3 3 3 3 3 3 3 3 3 3 3 3 3 2 2 2 2 2 2 2 2 2 2 2 2 2 2 2 2 2 2 2 2 2 2 2 2 2 2 2 2 2 2 2 2 2 2 2 2 2 2 2 2 2 2 2 2'
Get top 3 components#
for nodelist in sorted(nx.connected_components(G), key=len, reverse=True)[:3]:
    print(len(nodelist))
81
31
31
# top3_nodelists is just nodelists of top3 subgraph
top3_nodelists = sorted(nx.connected_components(G), key=len, reverse=True)[:3]

# Merge three nodelists
top3nodes = list(set().union(*top3_nodelists))

# top3nodes = []
# for nodelist in top3_nodelists:
#     top3nodes.extend(list(nodelist))

# Retrieve Subset of G
subG = G.subgraph(top3nodes)
sorted(list(subG.nodes))
len(subG.edges)
len(subG.nodes)
# len(G.nodes)
# len(G.edges)
143
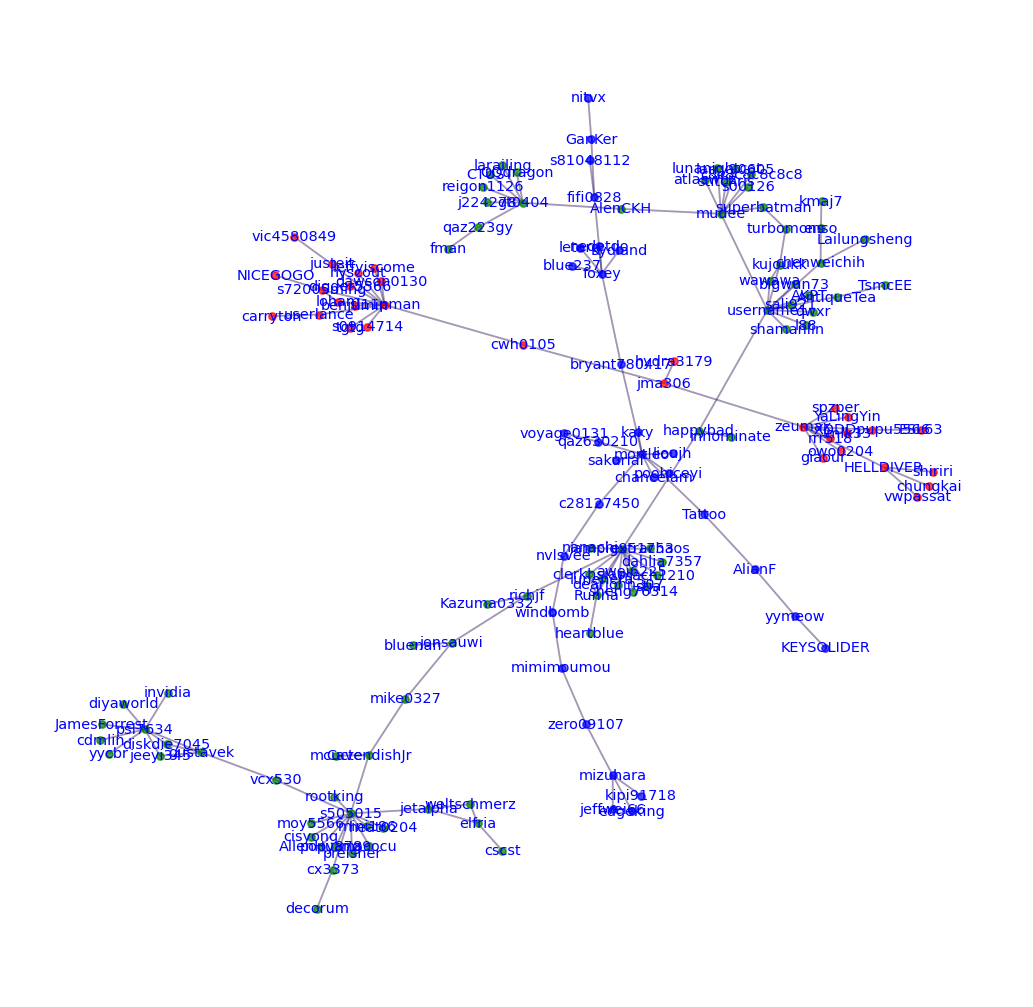
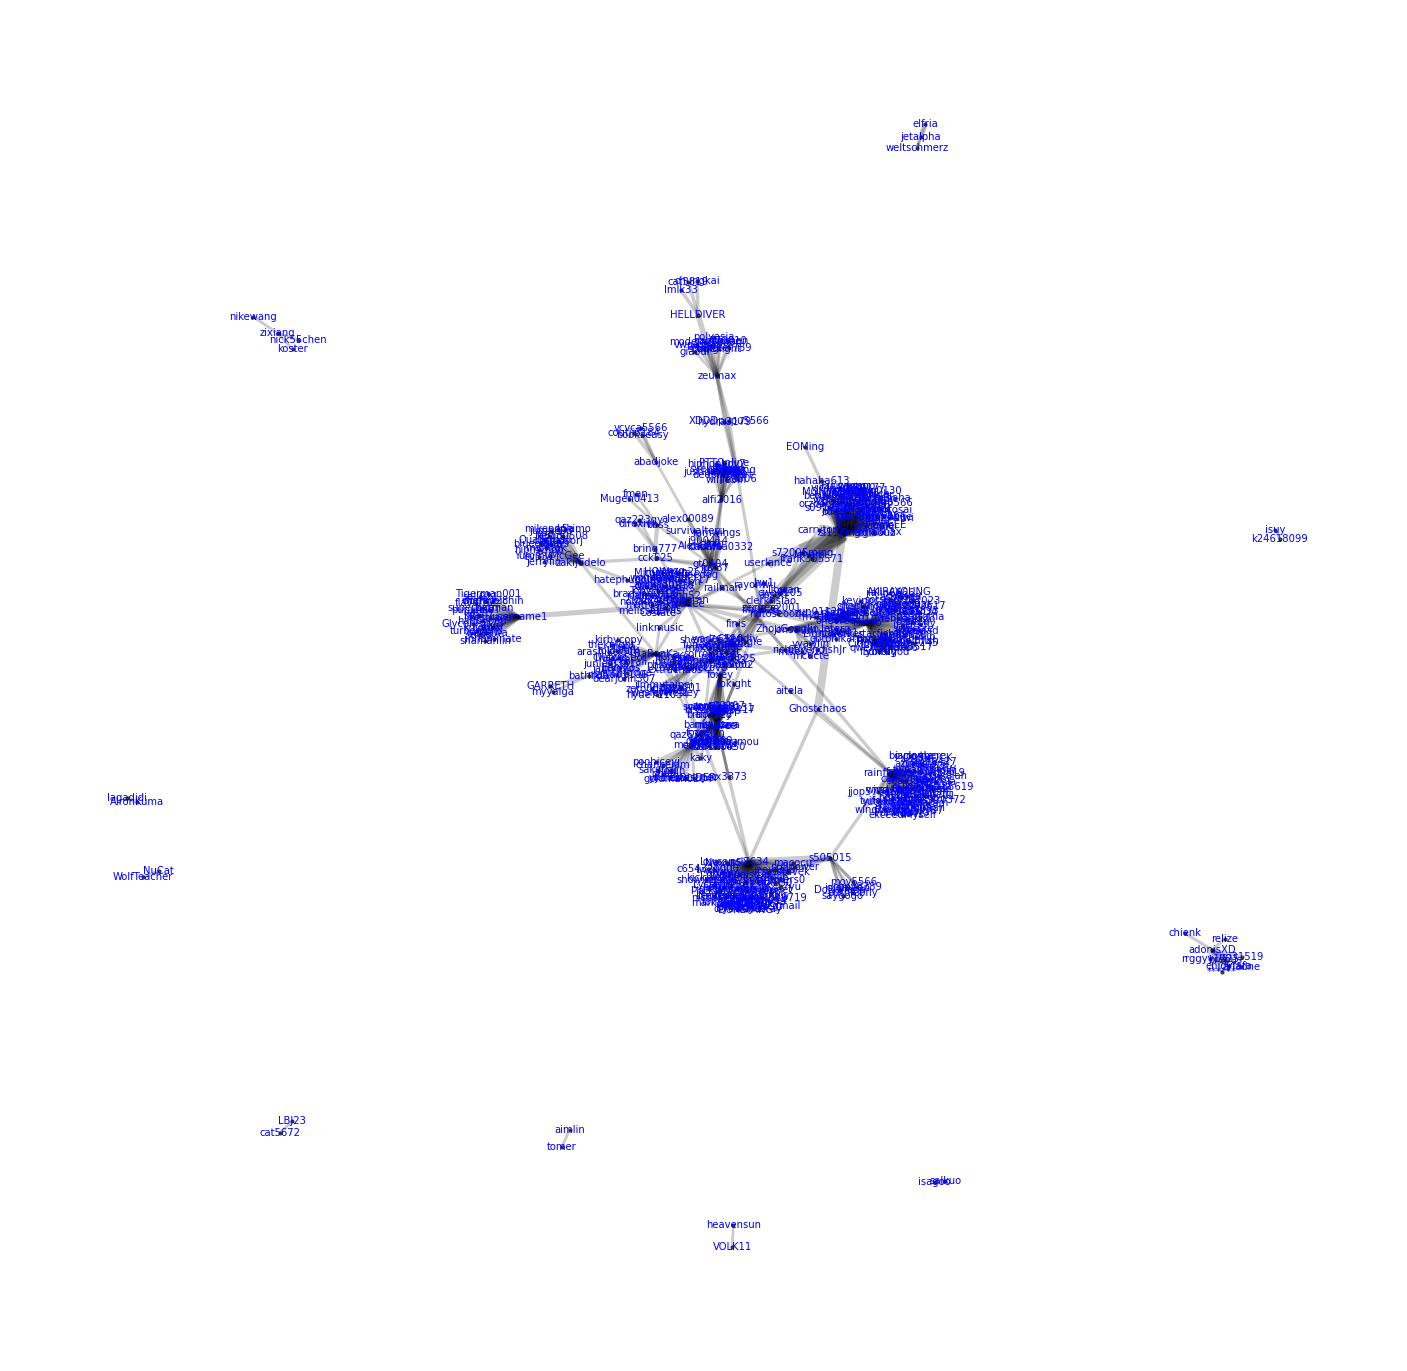
Viz by matplotlib#
fig = plt.figure(1, figsize=(10, 10), dpi=130)
colorlist = [ 'r', 'g', 'b', 'c', 'm', 'y', 'k' ]

pos = nx.spring_layout(subG)


for index, sg in enumerate(nx.connected_components(subG)):  #there's probably a more elegant approach using zip
    nx.draw_networkx_nodes(subG, pos=pos,
                           nodelist = sg,
                           node_size = 15,
                           node_color = colorlist[index],
                           alpha = 0.7)
    nx.draw_networkx_labels(subG, pos=pos,
                            labels=dict(zip(sg,sg)),
                            font_color='blue',
                            font_size=8)
    nx.draw_networkx_edges(subG, pos=pos,
                           edgelist = nx.get_edge_attributes(subG, 'n').keys(),
                           # width=list(nx.get_edge_attributes(subG, 'n').keys()),
                           edge_color=colorlist[index],
                           alpha=0.2)

plt.box(False)
plt.show()
Vis by pyviz#
attr = {node:index for index, sg in enumerate(nx.connected_components(subG)) for node in sg}
nx.set_node_attributes(subG, attr, name="group")
subG.nodes(data=True)
NodeDataView({'chungkai': {'size': 10, 'group': 0}, 'fman': {'size': 10, 'group': 1}, 'stja': {'size': 10, 'group': 1}, 'giaour': {'size': 10, 'group': 0}, 'superbatman': {'size': 10, 'group': 1}, 'AKPT': {'size': 10, 'group': 1}, 'jonsauwi': {'size': 10, 'group': 1}, 'owo0204': {'size': 10, 'group': 0}, 'cwh0105': {'size': 10, 'group': 0}, 'c28127450': {'size': 10, 'group': 2}, 'larailing': {'size': 10, 'group': 1}, 'preisner': {'size': 10, 'group': 1}, 'turbomons': {'size': 10, 'group': 1}, 'wawawa': {'size': 10, 'group': 1}, 'hydra3179': {'size': 10, 'group': 0}, 'diyaworld': {'size': 10, 'group': 1}, 'elfria': {'size': 10, 'group': 1}, 'sl11pman': {'size': 10, 'group': 0}, 'username1': {'size': 10, 'group': 1}, 'KEYSOLIDER': {'size': 10, 'group': 2}, 'bluenan': {'size': 10, 'group': 1}, 'hyscout': {'size': 10, 'group': 0}, 'iampig951753': {'size': 10, 'group': 1}, 'fifi0828': {'size': 10, 'group': 2}, 'loham': {'size': 10, 'group': 0}, 'digger5566': {'size': 10, 'group': 0}, 's0914714': {'size': 10, 'group': 0}, 'extrachaos': {'size': 10, 'group': 1}, 'mudee': {'size': 10, 'group': 1}, 'sali921': {'size': 10, 'group': 1}, 'rootking': {'size': 10, 'group': 1}, 'kipi91718': {'size': 10, 'group': 2}, 'heat0204': {'size': 10, 'group': 1}, 'kaky': {'size': 10, 'group': 2}, 'AntiqueTea': {'size': 10, 'group': 1}, 'AlianF': {'size': 10, 'group': 2}, 'Runna': {'size': 10, 'group': 1}, 'moy5566': {'size': 10, 'group': 1}, 'userlance': {'size': 10, 'group': 0}, 'cx3373': {'size': 10, 'group': 1}, 'kujoukk': {'size': 10, 'group': 1}, 'zeumax': {'size': 10, 'group': 0}, 'JamesForrest': {'size': 10, 'group': 1}, 'Kazuma0332': {'size': 10, 'group': 1}, 'cdmlin': {'size': 10, 'group': 1}, 'leffyiscome': {'size': 10, 'group': 0}, 'dahlia7357': {'size': 10, 'group': 1}, 'jma306': {'size': 10, 'group': 0}, 'gustavek': {'size': 10, 'group': 1}, 'poohiceyi': {'size': 10, 'group': 2}, 'atlaswhz': {'size': 10, 'group': 1}, 'AlenCKH': {'size': 10, 'group': 1}, 'stitchris': {'size': 10, 'group': 1}, 'popy8789': {'size': 10, 'group': 1}, 'Tattoo': {'size': 10, 'group': 2}, 'lunenera': {'size': 10, 'group': 1}, 'YaLingYin': {'size': 10, 'group': 0}, 'qaz630210': {'size': 10, 'group': 2}, 'lmlk33': {'size': 10, 'group': 0}, 'Kydland': {'size': 10, 'group': 2}, 'cisyong': {'size': 10, 'group': 1}, 'awei6225': {'size': 10, 'group': 1}, 'GanKer': {'size': 10, 'group': 2}, 'sakurial': {'size': 10, 'group': 2}, 'blue237': {'size': 10, 'group': 2}, 'ESL63': {'size': 10, 'group': 0}, 'tgtg': {'size': 10, 'group': 0}, 'happybad': {'size': 10, 'group': 1}, 'gt0404': {'size': 10, 'group': 1}, 'chenweichih': {'size': 10, 'group': 1}, 'mike0327': {'size': 10, 'group': 1}, 'qwxr': {'size': 10, 'group': 1}, 'cscst': {'size': 10, 'group': 1}, 'nvlsvee': {'size': 10, 'group': 2}, 'edgeking': {'size': 10, 'group': 2}, 'psl7634': {'size': 10, 'group': 1}, 'AllenHuang': {'size': 10, 'group': 1}, 'diskdie7045': {'size': 10, 'group': 1}, 'benjumin': {'size': 10, 'group': 0}, 'CavendishJr': {'size': 10, 'group': 1}, 'TsmcEE': {'size': 10, 'group': 1}, 'CTUST': {'size': 10, 'group': 1}, 'weltschmerz': {'size': 10, 'group': 1}, 'nitvx': {'size': 10, 'group': 2}, 'larry90605': {'size': 10, 'group': 1}, 'reigon1126': {'size': 10, 'group': 1}, 'spzper': {'size': 10, 'group': 0}, 'chanceiam': {'size': 10, 'group': 2}, 'nanachi': {'size': 10, 'group': 1}, 'j224278': {'size': 10, 'group': 1}, 'dawson0130': {'size': 10, 'group': 0}, 'kmaj7': {'size': 10, 'group': 1}, 'shiriri': {'size': 10, 'group': 0}, 'c8c8c8c8c8c8': {'size': 10, 'group': 1}, 'QQdragon': {'size': 10, 'group': 1}, 'jeeyi345': {'size': 10, 'group': 1}, 'lioujh': {'size': 10, 'group': 2}, 'vic4580849': {'size': 10, 'group': 0}, 'mcucte': {'size': 10, 'group': 1}, 'justeit': {'size': 10, 'group': 0}, 'mimimoumou': {'size': 10, 'group': 2}, 'windbomb': {'size': 10, 'group': 2}, 'mach1210': {'size': 10, 'group': 1}, 'dearjohn307': {'size': 10, 'group': 1}, 'yycbr': {'size': 10, 'group': 1}, 'heartblue': {'size': 10, 'group': 1}, 'macocu': {'size': 10, 'group': 1}, 'vcx530': {'size': 10, 'group': 1}, 's72005ming': {'size': 10, 'group': 0}, 'lunanightcat': {'size': 10, 'group': 1}, 'mini186': {'size': 10, 'group': 1}, 'bigwun73': {'size': 10, 'group': 1}, 'voyage0131': {'size': 10, 'group': 2}, 'enso': {'size': 10, 'group': 1}, 'mortleo': {'size': 10, 'group': 2}, 'NICEGOGO': {'size': 10, 'group': 0}, 'shamanlin': {'size': 10, 'group': 1}, 's00126': {'size': 10, 'group': 1}, 's81048112': {'size': 10, 'group': 2}, 'qaz223gy': {'size': 10, 'group': 1}, 'l88': {'size': 10, 'group': 1}, 'rrr518': {'size': 10, 'group': 0}, 'decorum': {'size': 10, 'group': 1}, 'clerkhsiao': {'size': 10, 'group': 1}, 'invidia': {'size': 10, 'group': 1}, 'innominate': {'size': 10, 'group': 1}, 'foxey': {'size': 10, 'group': 2}, 'richjf': {'size': 10, 'group': 1}, 'yymeow': {'size': 10, 'group': 2}, 'mizuhara': {'size': 10, 'group': 2}, 'zero09107': {'size': 10, 'group': 2}, 'bryant780417': {'size': 10, 'group': 2}, 'carryton': {'size': 10, 'group': 0}, 'HELLDIVER': {'size': 10, 'group': 0}, 'sheng76314': {'size': 10, 'group': 1}, 'nedetdo': {'size': 10, 'group': 2}, 'Lailungsheng': {'size': 10, 'group': 1}, 'jeffwei66': {'size': 10, 'group': 2}, 'leterg': {'size': 10, 'group': 2}, 'jetalpha': {'size': 10, 'group': 1}, 's505015': {'size': 10, 'group': 1}, 'XDDDpupu5566': {'size': 10, 'group': 0}, 'vwpassat': {'size': 10, 'group': 0}})
net = Network('1024px', '2048px', notebook=True)
net.from_nx(subG)
net.show_buttons(filter_=['physics'])
# net.show("test.html")
Local cdn resources have problems on chrome/safari when used in jupyter-notebook.
Community#
Build-up network#
from collections import Counter
user_pair_counts = Counter()
for post in all_post:
    for i, c1 in enumerate(post['comments']):
        for j, c2 in enumerate(post['comments']):
            if j != i:
                u1, u2 = c1['userid'], c2['userid']
                if u1 != u2:
                    user_pair_counts[(u1, u2)] += 1

for pair, c in user_pair_counts.most_common(10):
    print("%s\t%s\t%d" % (pair[0], pair[1], c))

li = [(u1, u2, n)for (u1, u2), n in user_pair_counts.most_common() if n > 10]
df = pd.DataFrame.from_records(li, columns =['u1', 'u2', 'n'])
df
s72005ming	sl11pman	450
loham	sl11pman	450
sl11pman	s72005ming	450
sl11pman	loham	450
cwh0105	sl11pman	360
sl11pman	cwh0105	360
iampig951753	Runna	308
Runna	iampig951753	308
frank355571	sl11pman	270
sl11pman	frank355571	270
| u1 | u2 | n | |
|---|---|---|---|
| 0 | s72005ming | sl11pman | 450 |
| 1 | loham | sl11pman | 450 |
| 2 | sl11pman | s72005ming | 450 |
| 3 | sl11pman | loham | 450 |
| 4 | cwh0105 | sl11pman | 360 |
| ... | ... | ... | ... |
| 1483 | superbatman | username1 | 11 |
| 1484 | vwpassat | zeumax | 11 |
| 1485 | zeumax | vwpassat | 11 |
| 1486 | zeumax | giaour | 11 |
| 1487 | giaour | zeumax | 11 |
1488 rows × 3 columns
Drawing original network#
import math
import matplotlib.pyplot as plt
import networkx as nx

fig = plt.figure(1, figsize=(30, 30), dpi=60)

G = nx.from_pandas_edgelist(df,
                            source = 'u1',
                            target = 'u2',
                            edge_attr = 'n')

widths = nx.get_edge_attributes(G, 'n')
nodelist = G.nodes()
# nx.draw_kamada_kawai(G,
#                     node_size = 5,
#                     edge_color = "#8833FF",
#                     with_labels = True)

pos = nx.spring_layout(G)
# nx.draw_spring(G,
#                node_size = 5,
#                edge_color = "#8833FF",
#                font_size = 16,
#                with_labels = True)

nx.draw_networkx_nodes(G, pos,
                       nodelist=nodelist,
                       node_size=15,
                       node_color='black',
                       alpha=0.7)

nx.draw_networkx_edges(G,pos,
                       edgelist = widths.keys(),
                       width=list([math.sqrt(w) for w in widths.values()]),
                       edge_color='black',
                       alpha=0.2)

nx.draw_networkx_labels(G, pos=pos,
                        labels=dict(zip(nodelist,nodelist)),
                        font_color='blue')
plt.box(False)
plt.show()
Maximum component#
topG = sorted(nx.connected_components(G), key=len, reverse=True)[0]
len(topG)

subG = G.subgraph(topG)
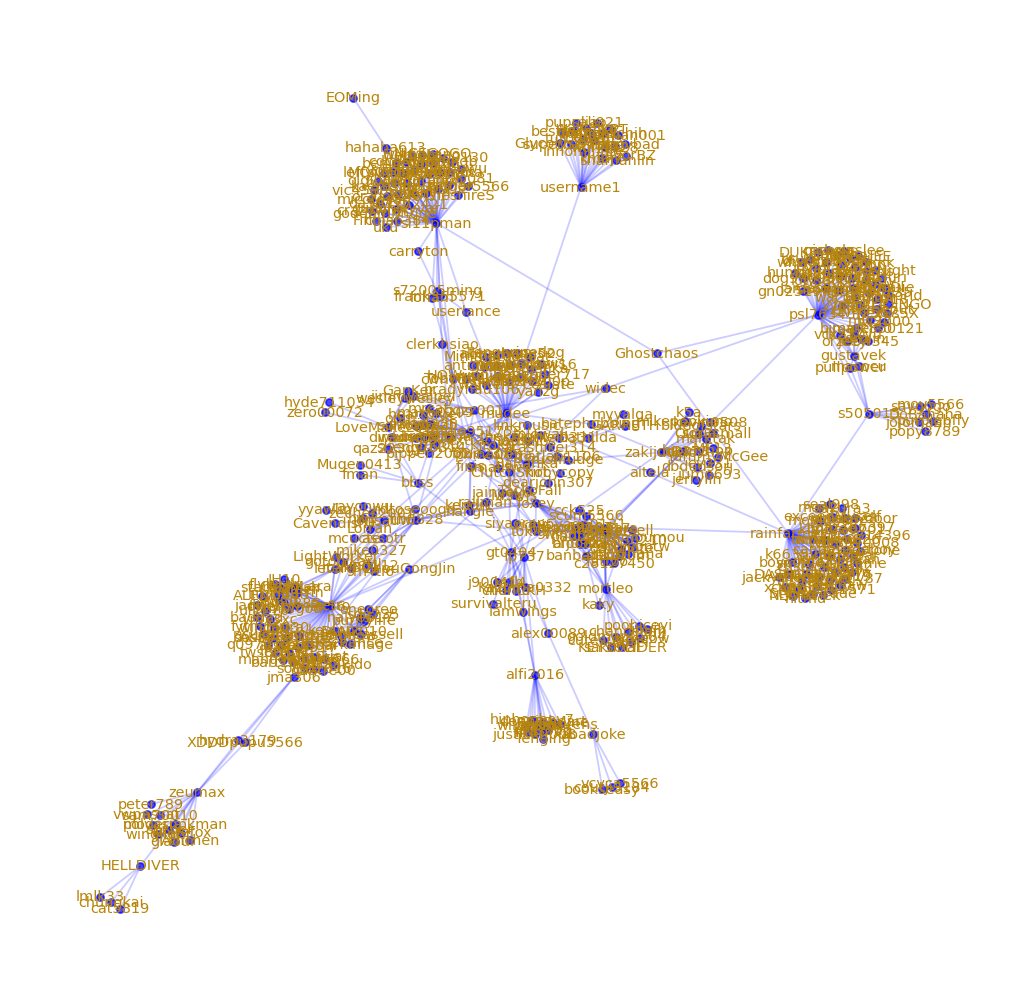
Viz the maximum component#
fig = plt.figure(1, figsize=(10, 10), dpi=130)
colorlist = [ 'b', 'g', 'b', 'c', 'm', 'y', 'k' ]

pos = nx.spring_layout(subG)


for index, sg in enumerate(nx.connected_components(subG)):  #there's probably a more elegant approach using zip
    nx.draw_networkx_nodes(subG, pos=pos,
                           nodelist = sg,
                           node_size = 15,
                           node_color = colorlist[index],
                           alpha = 0.7)
    nx.draw_networkx_labels(subG, pos=pos,
                            labels=dict(zip(sg,sg)),
                            font_color='darkgoldenrod',
                            font_size=8)
    nx.draw_networkx_edges(subG, pos=pos,
                           edgelist = nx.get_edge_attributes(subG, 'n').keys(),
                           # width=list(nx.get_edge_attributes(subG, 'n').keys()),
                           edge_color=colorlist[index],
                           alpha=0.2)
plt.box(False)
plt.show()
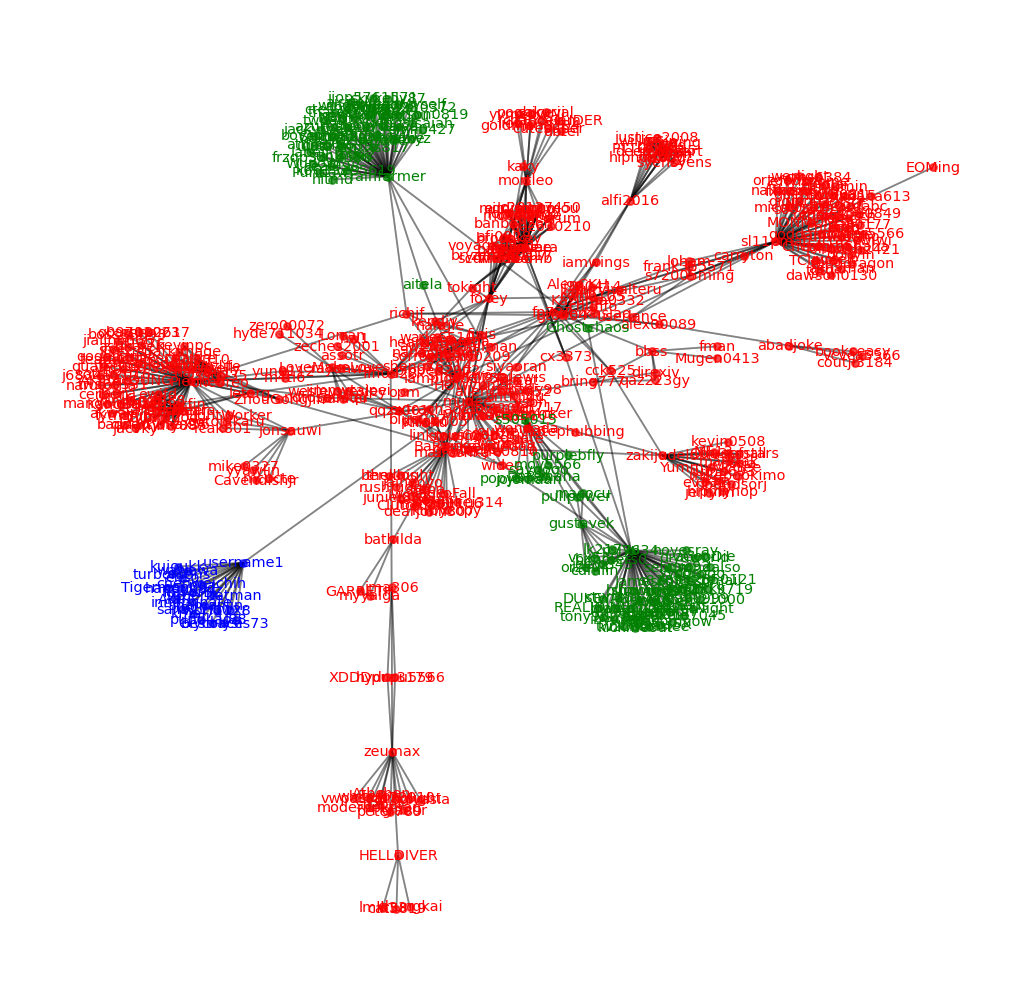
Detect communities#
from networkx.algorithms import community
communities_generator = community.girvan_newman(subG)
top_level_communities = next(communities_generator)
second_level_communities = next(communities_generator)
print(len(top_level_communities))
print(len(second_level_communities))
2
3
Viz communities#
fig = plt.figure(1, figsize=(10, 10), dpi=130)
colorlist = [ 'r', 'g', 'b', 'c', 'm', 'y', 'k' ]

pos = nx.spring_layout(subG)
for index, sg in enumerate(second_level_communities):  #there's probably a more elegant approach using zip
    nx.draw_networkx_nodes(subG, pos=pos,
                           nodelist = sg,
                           node_size = 15,
                           node_color = colorlist[index],
                           alpha = 0.7)
    nx.draw_networkx_labels(subG, pos=pos,
                            labels=dict(zip(sg,sg)),
                            font_color=colorlist[index],
                            font_size=8)
    nx.draw_networkx_edges(subG, pos=pos,
                           edgelist = nx.get_edge_attributes(subG, 'n').keys(),
                           # width=list(nx.get_edge_attributes(subG, 'n').keys()),
                           # edge_color=colorlist[index],
                           alpha=0.2)

plt.box(False)
plt.show()
viz communities by pyvis#
# from pyvis.network import Network as net
from pyvis import network as net
# net = Network('1024px', '2048px', notebook=True)

attr = {node:index for index, sg in enumerate(second_level_communities) for node in sg}
nx.set_node_attributes(subG, attr, name="group")
visnet = net.Network('768px', '768px', notebook=True)
# net = Network('768px', '768px')
visnet.from_nx(subG)
visnet.show('nx.html')
Local cdn resources have problems on chrome/safari when used in jupyter-notebook.