Chapter 27 ASSOCIATION
27.1 等比例座標軸
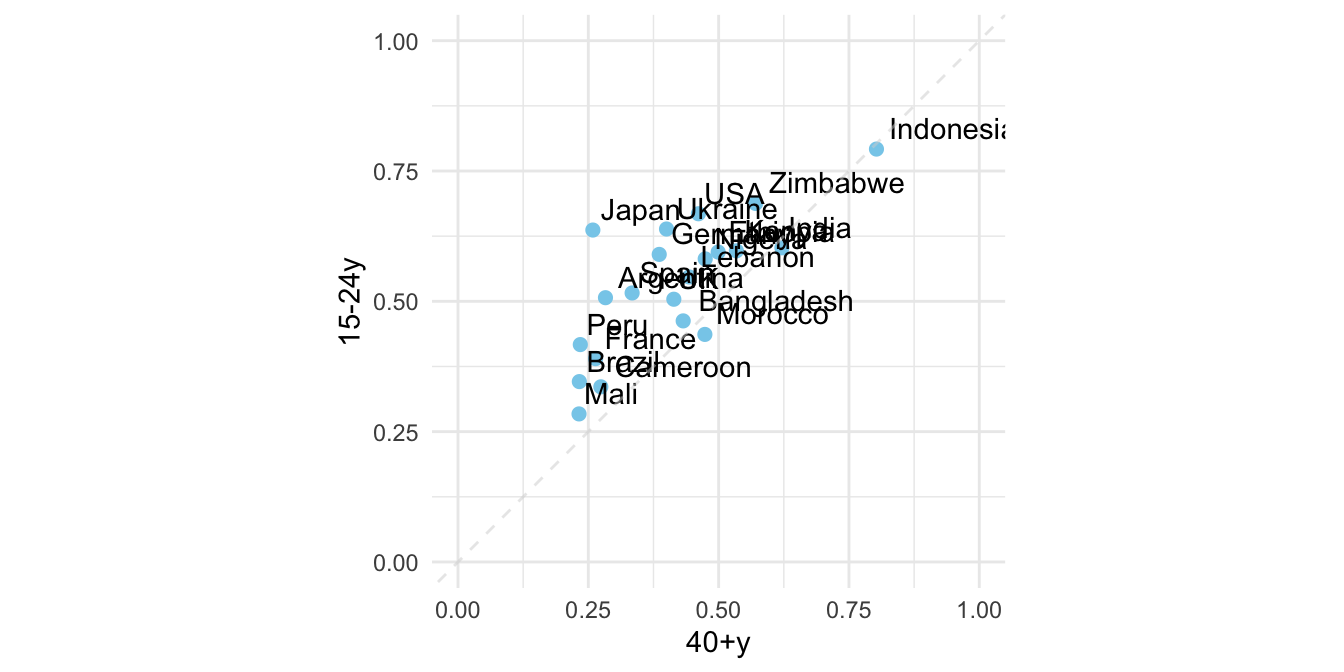
27.1.1 UNICEF-Optimistic (WGOITH)
https://www.nytimes.com/2021/11/17/upshot/global-survey-optimism.html https://changingchildhood.unicef.org/about
plot.opt <- read_csv("data/unicef-changing-childhood-data.csv") %>%
    select(country = WP5, age = WP22140, bw = WP22092) %>%
    mutate(country = ordered(country,
                             levels=c(1, 3, 4, 10, 11, 12,
                                      13, 14, 17, 29, 31,
                                      33, 35, 36, 60, 61,
                                      77, 79, 81, 87, 165),
                             labels=c("USA", "Morocco", "Lebanon",
                                      "Indonesia", "Bangladesh",
                                      "UK", "France", "Germany",
                                      "Spain", "Japan", "India",
                                      "Brazil", "Nigeria", "Kenya",
                                      "Ethiopia", "Mali", "Ukraine",
                                      "Cameroon", "Zimbabwe",
                                      "Argentina", "Peru"))) %>%
    count(country, age, bw) %>%
    group_by(country, age) %>%
    mutate(perc = n/sum(n)) %>%
    ungroup() %>%
    filter(bw == 1) %>%
    select(country, age, perc) %>%
    spread(age, perc) %>%
    rename(`15-24y` = `1`, `40+y` = `2`)

plot.opt %>% head(10) %>% knitr::kable()| country | 15-24y | 40+y |
|---|---|---|
| USA | 0.6679842 | 0.4611465 |
| Morocco | 0.4365079 | 0.4735812 |
| Lebanon | 0.5467197 | 0.4435798 |
| Indonesia | 0.7920605 | 0.8027344 |
| Bangladesh | 0.4624506 | 0.4319527 |
| UK | 0.5040000 | 0.4140000 |
| France | 0.3900000 | 0.2640000 |
| Germany | 0.5900000 | 0.3860000 |
| Spain | 0.5160000 | 0.3340000 |
| Japan | 0.6367265 | 0.2586873 |
plot.opt %>%
    ggplot() + aes(`40+y`, `15-24y`, label = country) +
    geom_point(color = "skyblue", size = 2) +
    xlim(0, 1) + ylim(0,1) +
    geom_text(hjust = -0.1, vjust = -0.5) +
    geom_abline(intercept = 0, slop = 1,
                color="lightgrey", alpha=0.5, linetype="dashed") +
    theme_minimal() +
    theme(aspect.ratio=1)