Chapter 4 DataFrame
DataFrame 是 R 語言中最常用的資料結構之一,它是一種表格形式的數據集,類似於 Excel 表格或 SQL 資料表。每一列代表一個變數(Variable),而每一行代表一個觀測值(Observation)。
DataFrame 具備以下特性:
列(Row):每一列都是一個完整的觀測數據。
欄(Column):每一欄是相同型態的變數,例如數字、文字、因子等。
索引(Index):R 自動為 DataFrame 的列加上索引,方便存取數據。
4.1 基本操作
4.1.1 產生新的Dataframe
在 R 中,可以透過 data.frame() 函數將數個等長的向量(Vectors)合併為 DataFrame。例如,我們建立台北市各行政區的基本資料,包括區名、面積(平方公里)和人口數(2023 年估計值)。
- 用以下ChatGPT問句來產生測試資料「我現在正在準備R的教學範例, 請協助我產生台北市所有行政區的資料,包含行政區名、面積、人口數 分別指給town, area, population三個變數」。
town = c("松山區", "信義區", "大安區", "中山區", "中正區", "大同區", "萬華區", "文山區", "南港區", "內湖區", "士林區", "北投區")

area = c(9.2878, 11.2077, 11.3614, 13.6821, 7.6071, 5.6815, 8.8522, 31.5090, 21.8424, 31.5787, 62.3682, 56.8216) # 單位:平方公里

population = c(206375, 225561, 309835, 203276, 159608, 132397, 194160, 275207, 122103, 287726, 288324, 255688)  # 2023年的估計值
4.1.1.1 合併等長vector為DataFrame
data.frame(town, population, area):將三個向量合併成一個 DataFrame。df$density <- df$population / df$area:新增一欄「人口密度」,計算方式為人口數除以區域面積。str(df):顯示 DataFrame 的結構資訊。summary(df):輸出基本統計摘要,例如平均數、中位數、最小值、最大值等。
## 'data.frame':    6 obs. of  4 variables:
##  $ town      : chr  "中正" "大同" "中山" "松山" ...
##  $ population: num  158228 126687 228075 204903 308383 ...
##  $ area      : num  7.61 5.68 13.68 9.29 11.36 ...
## $ density : num 20800 22298 16670 22062 27143 ...## town population area density
## Length:6 Min. :126687 Min. : 5.681 Min. :16670
## Class :character 1st Qu.:165651 1st Qu.: 7.918 1st Qu.:20907
## Mode :character Median :196412 Median : 9.070 Median :21645
## Mean :202366 Mean : 9.412 Mean :21700
## 3rd Qu.:222282 3rd Qu.:10.843 3rd Qu.:22239
## Max. :308383 Max. :13.682 Max. :271434.1.1.2 範例:臺灣貿易各國進出口量
- 運用國際貿易署貿易統計系統 (trade.gov.tw)獲取臺灣進出口貿易資料。
country <- c("CN", "US", "JP", "HK", "KR", "SG", "DE", "MY", "VN", "PH", "TH", "AU", "NL", "SA", "ID", "GB", "IN", "FR", "IT", "AE")

import <- c(26.142, 12.008, 7.032, 13.646, 4.589, 5.768, 2.131, 2.802, 3.428, 3.019, 1.976, 1.118, 1.624, 0.449, 0.983, 1.302, 1.027, 0.553, 0.670, 0.455)

export <- c(22.987, 12.204, 11.837, 7.739, 5.381, 4.610, 2.866, 2.784, 2.414, 2.092, 1.839, 1.788, 1.665, 1.409, 1.391, 1.075, 0.974, 0.899, 0.800, 0.728)
4.1.1.3 合併vector為data.frame
在 R 早期版本中,當我們讀取或創建資料框架(DataFrame)時,R 預設會將字串類型的變數轉換為因子(Factors)。這樣的設計對於統計分析是有益的,因為統計方法通常將文字數據視為類別變數來處理。然而,隨著資料科學領域的快速發展,需要處理大量文字數據的情況日益增多,因此將字串自動轉換為因子可能不再適用於所有情境。
## 'data.frame':    20 obs. of  3 variables:
##  $ country: chr  "CN" "US" "JP" "HK" ...
##  $ import : num  26.14 12.01 7.03 13.65 4.59 ...
##  $ export : num  22.99 12.2 11.84 7.74 5.38 ...
自 R 4.0 起,R 的預設行為已改變,現在建立 DataFrame 或讀取數據時,字串變數預設會保持為字串(Character),而不會自動轉換為因子。這意味著,當我們使用 data.frame() 或 read.csv() 等函數讀取數據時,除非明確指定,R 不會自動將字串轉換為因子。
如果你在統計分析中仍然希望將文字型態的變數作為類別變數(即因子)處理,你需要手動進行轉換。例如:在合併資料時,若希望所有Character變數自動轉換為Factor,可以這樣設定:
## 'data.frame':    20 obs. of  3 variables:
##  $ country: Factor w/ 20 levels "AE","AU","CN",..: 3 19 11 7 12 17 4 13 20 15 ...
##  $ import : num  26.14 12.01 7.03 13.65 4.59 ...
## $ export : num 22.99 12.2 11.84 7.74 5.38 ...其他功能:建立一個新且空的data.frame。
4.1.2 觀察dataframe
當我們處理數據框架(dataframe)時,有幾種常用的方法可以幫助我們更好地了解和觀察數據的結構和內容。
View(df): 使用RStudio提供的圖形使用者介面直接觀看dataframe。這個功能允許你直觀地瀏覽整個數據集,方便地查看不同行(變數)和列(觀測值)。這對於初步瞭解數據的分佈和檢查數據的格式特別有用。head(df): 這個函數用於取出數據框架的前六筆資料(也就是前六列)。這可以讓我們快速概覽數據集的開頭部分,了解數據的基本結構和內容。如果需要查看更多或更少的列,可以向head函數傳遞一個額外的參數,如head(df, n = 10)來查看前十列。class(df): 此函數返回該變數的類型。對於dataframe,它將返回”DataFrame”,表明該對象是一個dataframe。了解對象的類型是重要的基礎步驟,尤其是在R中,不同類型的變項能夠做的操作和應用的函數也不同。str(df):str是結構(structure)的縮寫,這個函數提供了dataframe的詳細結構信息,包括變項的數量、變項名稱、變項數據類型以及每個變項前幾個值。這是一個非常強大的函數,用於深入了解數據集的內部結構,特別是當處理大型數據集時。summary(df): 此函數提供了數據框架的摘要統計信息,包括數值變數的最小值、最大值、中位數、平均值、第一四分位數和第三四分位數,以及因子變數的水平計數。這對於快速獲取數據集的統計概述非常有用。
##   country import export
## 1      CN 26.142 22.987
## 2      US 12.008 12.204
## 3      JP  7.032 11.837
## 4      HK 13.646  7.739
## 5      KR  4.589  5.381
## 6 SG 5.768 4.610## [1] "data.frame"## 'data.frame': 20 obs. of 3 variables:
## $ country: Factor w/ 20 levels "AE","AU","CN",..: 3 19 11 7 12 17 4 13 20 15 ...
## $ import : num 26.14 12.01 7.03 13.65 4.59 ...
## $ export : num 22.99 12.2 11.84 7.74 5.38 ...## country import export
## AE : 1 Min. : 0.449 Min. : 0.728
## AU : 1 1st Qu.: 1.016 1st Qu.: 1.312
## CN : 1 Median : 2.054 Median : 1.966
## DE : 1 Mean : 4.536 Mean : 4.374
## FR : 1 3rd Qu.: 4.884 3rd Qu.: 4.803
## GB : 1 Max. :26.142 Max. :22.987
## (Other):144.1.3 操作dataframe
以下將介紹 DataFrame 的基本操作,包括變數提取、變數創建、篩選數據、排序等常見應用。
4.1.3.1 選擇某變項(Select)
names(df)列出變數名稱。df$發生.現.地點顯示該變數內容df$發生時段顯示該變數內容length(df$發生時段)顯示該變數的長度(相當於有幾個)summary()函數可以用來查看數據的基本統計資訊,例如最小值、最大值、平均數、四分位數等:
## [1] "country" "import" "export"## [1] 22.987 12.204 11.837 7.739 5.381 4.610## [1] 20## country import export
## AE : 1 Min. : 0.449 Min. : 0.728
## AU : 1 1st Qu.: 1.016 1st Qu.: 1.312
## CN : 1 Median : 2.054 Median : 1.966
## DE : 1 Mean : 4.536 Mean : 4.374
## FR : 1 3rd Qu.: 4.884 3rd Qu.: 4.803
## GB : 1 Max. :26.142 Max. :22.987
## (Other):144.1.3.2 創建新變數(Mutate)
- 在 DataFrame 中,我們可以使用
$符號來新增一個變數,並且透過四則運算來計算新變數的值。在 R 中,尤其是未來運用到 dplyr 套件時,會把DataFrame新增一個變項的動作稱為Mutate,亦即透過運算新增變項。 - 這裡容易犯錯的是,要記得跟程式講說你要加總或四則運算的是哪個df的variable。
- 從下面的這個操作中,該data.frame會產生一個新的變數
sub,這就相當於Excel中的某一行減去某一行,然後把資料放在新的一行。
4.1.3.3 篩選資料(Filter)
注意,要告訴程式
import和export是哪個data.frame的。df[,]為存取df中某個區段的數值或某個數值的方法。因此df[1, 1]會取出第一行第一列,也就是第一筆資料的第一個vector。df[2, 3]則會取出第二筆資料的第三個variable。下面的例子
nrow(df)為1894,有1894筆資料,所以自然df\(import與df\)export的長度都是1894。因此,比較這兩個變數的大小會得到一個長度為1894的boolean (logical) variable。因此把這個長度為1894、充滿TRUE和FALSE的logical vector丟進df的row之處,因為取自df,大小判斷式結果的長度自然和原本的df的列數相同。因此當這個TRUE/FALSE被丟在df的列之處,便會篩選出import大於p.xport的數值。原本的df有五個variable,而上述的操作是篩選資料,所以被篩選的是列,因此行的數量、名稱都不會變。因此,我篩選完後,直接存取這個被篩選過的data.frame的country variable,自然是可以的。
##    country import export    sub
## 1       CN 26.142 22.987  3.155
## 2       US 12.008 12.204 -0.196
## 3       JP  7.032 11.837 -4.805
## 4       HK 13.646  7.739  5.907
## 5       KR  4.589  5.381 -0.792
## 6       SG  5.768  4.610  1.158
## 7       DE  2.131  2.866 -0.735
## 8       MY  2.802  2.784  0.018
## 9       VN  3.428  2.414  1.014
## 10      PH  3.019  2.092  0.927
## 11      TH  1.976  1.839  0.137
## 12      AU  1.118  1.788 -0.670
## 13      NL  1.624  1.665 -0.041
## 14      SA  0.449  1.409 -0.960
## 15      ID  0.983  1.391 -0.408
## 16      GB  1.302  1.075  0.227
## 17      IN  1.027  0.974  0.053
## 18      FR  0.553  0.899 -0.346
## 19      IT  0.670  0.800 -0.130
## 20 AE 0.455 0.728 -0.273## [1] "country" "import" "export" "sub"## [1] 20## country import export sub
## 1 CN 26.142 22.987 3.155
## 4 HK 13.646 7.739 5.907
## 6 SG 5.768 4.610 1.158
## 8 MY 2.802 2.784 0.018
## 9 VN 3.428 2.414 1.014
## 10 PH 3.019 2.092 0.927
## 11 TH 1.976 1.839 0.137
## 16 GB 1.302 1.075 0.227
## 17 IN 1.027 0.974 0.053## [1] CN HK SG MY VN PH TH GB IN
## Levels: AE AU CN DE FR GB HK ID IN IT JP KR MY NL PH SA SG TH US VN## [1] CN HK SG MY VN PH TH GB IN
## Levels: AE AU CN DE FR GB HK ID IN IT JP KR MY NL PH SA SG TH US VN## [1] "factor"## [1] "factor"## [1] "data.frame"## [1] "numeric"4.1.3.4 按某個變數排序(Arrange)
對於DataFrame這樣一個有很多欄位(變項)的資料表,我們常會希望能夠依據哪一個變項從小而大或從大而小做排序。例如依據價格做排序、依據資料建立先後來排序。此時要用 order() ,未來在dplyr中會用 arrange()。
df.sorted <- df[order(df$import),]會使得整個df照import的大小排序重新做排列。因為order(df$import)會把資料照指定順序排列後的位置傳回來,所以把他丟給df的列的位置,便會使得df的資料照指定的順序排列。 預設是由小到大,加上decreasing = T這個參數後變成由大而小。
# sort rows by df$import column
df.sorted <- df[order(df$import),]
# View(df.sorted)

# sort rows in decreasing order
df.sorted <- df[order(df$import, decreasing = T),]

# add - to column in order() can sort in decreasing order
df.sorted <- df[order(-df$import),]

head(df.sorted)
## country import export sub
## 1 CN 26.142 22.987 3.155
## 4 HK 13.646 7.739 5.907
## 2 US 12.008 12.204 -0.196
## 3 JP 7.032 11.837 -4.805
## 6 SG 5.768 4.610 1.158
## 5 KR 4.589 5.381 -0.7924.2 簡易繪圖
graphics::plot()為會預載入R的繪圖套件,如果希望繪圖的同時加上回歸線和資料點標籤的話,必須要三行一起執行。

plot(df[1:10, 2:3])
text(import, export, labels=country, cex= 0.5, pos=3)
lines(1:25, 1:25, col='red')
## Help on topic 'plot' was found in the following packages:
##
##   Package               Library
##   base                  /Library/Frameworks/R.framework/Resources/library
##   graphics              /Library/Frameworks/R.framework/Versions/4.4-arm64/Resources/library
##
##
## Using the first match ...
4.3 延伸學習
4.3.1 預覽dplyr
library(dplyr)
df <- data.frame(country, import, export, stringsAsFactors = F)
df <- mutate(df, sub = import - export)
filter(df, import > export)
## country import export sub
## 1 CN 26.142 22.987 3.155
## 2 HK 13.646 7.739 5.907
## 3 SG 5.768 4.610 1.158
## 4 MY 2.802 2.784 0.018
## 5 VN 3.428 2.414 1.014
## 6 PH 3.019 2.092 0.927
## 7 TH 1.976 1.839 0.137
## 8 GB 1.302 1.075 0.227
## 9 IN 1.027 0.974 0.053## country export
## 1 CN 22.987
## 2 US 12.204
## 3 JP 11.837
## 4 HK 7.739
## 5 KR 5.381
## 6 SG 4.610
## 7 DE 2.866
## 8 MY 2.784
## 9 VN 2.414
## 10 PH 2.092
## 11 TH 1.839
## 12 AU 1.788
## 13 NL 1.665
## 14 SA 1.409
## 15 ID 1.391
## 16 GB 1.075
## 17 IN 0.974
## 18 FR 0.899
## 19 IT 0.800
## 20 AE 0.728## [1] "CN" "US" "JP" "HK" "KR" "SG" "DE" "MY" "VN" "PH" "TH" "AU" "NL" "SA" "ID"
## [16] "GB" "IN" "FR" "IT" "AE"4.4 Paid Maternity Leave
本案例將使用R重新製作華盛頓郵報2016年8月13日的一篇報導,該報導探討了美國婦女產假支薪情況。案例中將應用data.frame和基本的繪圖與資料摘要方法。
原始新聞來源:The world is getting better at paid maternity leave. The U.S. is not. - The Washington Post。該篇報導提及,美國因為目前的政策不保障帶薪產假,許多女性感到必須在工作和照顧家庭之間做出選擇,這種性別不平等破壞了她們在工作機會上的平等機會。同時,世界各地的婦女待遇正在逐漸改善。至少190個國家對嬰兒的母親規定了某種形式的帶薪假期,產假待遇在52個國家有所提高。專家表示,現在美國城市和州正通過不同形式的帶薪家庭假法案,這顯示美國雇主正在展示有競爭力的福利不會影響員工表現。記者選定了「美國沒有產假支薪」作為新聞切入點。在呈現的時候,就必須要盡可能地凸顯這樣的情形。一般來說,會繪製世界地圖且用顏色來凸顯美國是目前少數沒有產假支薪的國家之一如下:

4.4.1 The Data
該筆資料來自位於UCLA公衛學院的World Policy Analysis Center,其包含兩個壓縮檔,分別為橫斷式資料與部分資料的縱貫性資料。就產假支薪而言,其調查了198個國家的政策,將支薪週數分為五個等級,並蒐錄了1995年至2013年間的變化(matleave_95~matleave13)。通常在資料分析時,應先閱讀資料了解資料。首先要先觀察資料,開啟資料後概略如下:
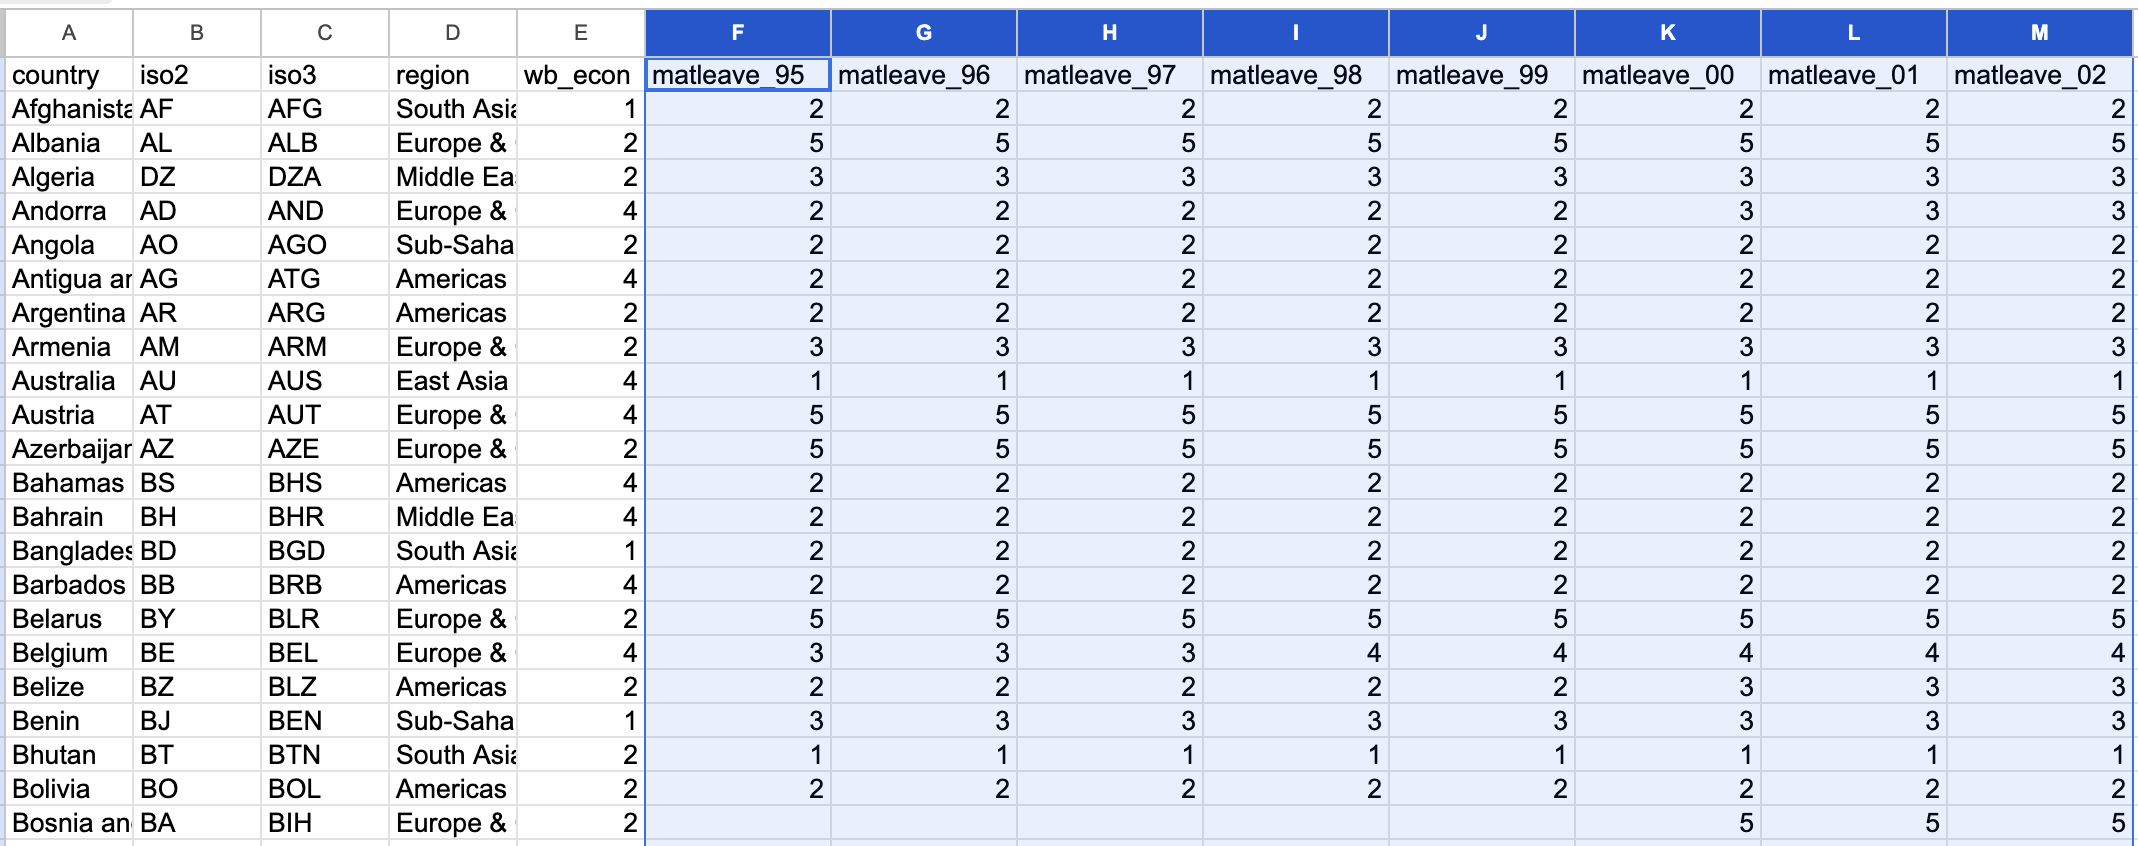
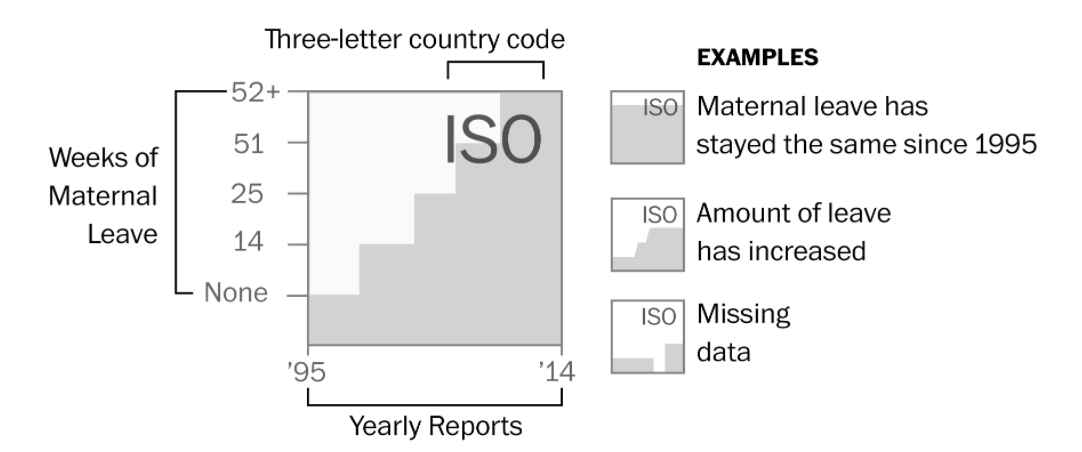
打開資料後便先觀察資料的「列(Row)」是什麼?又有哪些「欄(Column)」?通常在列上的會是逐筆的觀察值,如前述資料每一筆是個國家,而欄上面則是每個觀察所觀察到的變項,例如國名縮寫(iso2、iso3)、地區(region)、經濟等級(wb_econ)、和本案例所要觀察的產假支付等級。但產假支付等級可以看從matleave_95到matleave_13共19欄是19年的資料,數值為1到5,空白的通常是該年沒記錄到的缺漏值。通常統計資料如果是用等第來紀錄的話,會給編碼表,也就是1到5分別代表哪種等級、哪種程度。這份資料也有給編碼表如下,產假給付程度在該調查中分為五個等級,包含1(0週)、2(0-14週)、3(14-25週)、4(26-51週)、5(52週以上)等。
4.4.2 Visual Strategies
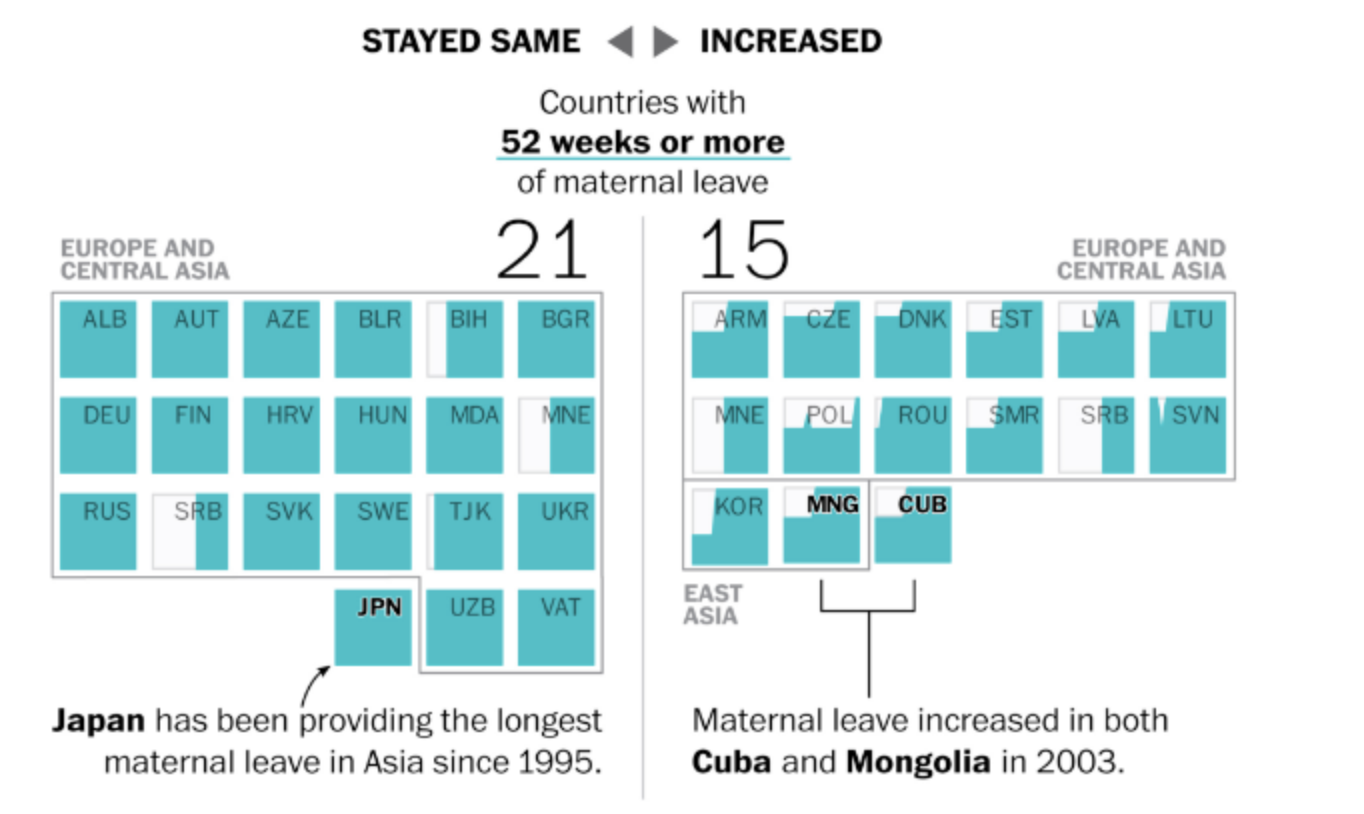
但如果只是繪製地圖,卻又略顯單薄。而該筆來自Word Policy Analysis Center資料其實含有自1995年至2003年共19年的資料(本案例即就是下載該中心所分享的調查資料,不用申請帳號)。於是該專題的作者便利用這些歷史資料,進一步凸顯美國在這方面一直沒有改變,始終都是保持0週,即使其他各國逐漸在調高產假的給付程度。但要處理197個國家的在19年間的變化相當不易。若為每年繪製一張世界地圖,然後以動畫或動態卷軸來凸顯這19年間美國的變化,也會因為國家數過多而難以聚焦在作者想突顯的美國。
而這便是作者在視覺化上相當具有巧思的地方。作者便從給付程度最高的層級開始做長條圖,共五個階層的子圖。而每個階層的子圖,作者又將該層級的圖分為「保持不變(Stay Same)」和「持續增加(Increase)」兩組。經過這樣的分組,會得到9個子圖。分別為等級5(保持不變、持續增加)、等級4(保持不變、持續增加)、…、等級1(保持不變)。讀者在看的時候,會依次看到給付程度最高到最低的國家,也可以看到哪些國家在這19年間制度有所變化(通常是增加)。但看到最後的時候,便會看到美國的情形,即是無產假給付。
4.4.3 Cleaning
4.4.3.1 Read .xlsx
在進行產假支薪調查數據的分析與視覺化時,我們從該調查網站上所下載的資料是一個Excel文件。由於R語言本身不直接支援讀取Excel格式的文件,我們必須依靠外部的套件來實現這一功能,如readxl套件。它是專門設計來讀取.xls和.xlsx格式文件的強大工具。readxl套件是tidyverse套件集的一部分。tidyverse是一組旨在數據科學和數據處理領域提供便利的R套件集合,包括了ggplot2、dplyr、tidyr等多個流行的套件。如果你之前已經安裝了tidyverse,那麼readxl套件應該也已經安裝在你的系統上,無需進行重複安裝。
然而,即便readxl已經安裝,它並不會隨著tidyverse套件集的其他部分自動加載到R的執行環境中。這意味著,在你打算使用readxl套件來讀取Excel文件之前,需要先手動執行library(readxl)命令來加載它。
這段程式碼使用read_excel()函式從data資料夾中的WORLD-MACHE_Gender_6.8.15.xls檔案中的Sheet1工作表讀取資料。其中col_names=T為該函式的參數,表示第一列為欄位名稱。讀取後的資料會被Assign給變數df。
4.4.3.2 Preview data
Preview data by View(), class(), dim(), str(), summary() and names()
## [1] "tbl_df" "tbl" "data.frame"## [1] 197 156## [1] "country" "iso2" "iso3"
## [4] "region" "wb_econ" "matleave_95"
## [7] "matleave_96" "matleave_97" "matleave_98"
## [10] "matleave_99" "matleave_00" "matleave_01"
## [13] "matleave_02" "matleave_03" "matleave_04"
## [16] "matleave_05" "matleave_06" "matleave_07"
## [19] "matleave_08" "matleave_09" "matleave_10"
## [22] "matleave_11" "matleave_12" "matleave_13"
## [25] "matleave_wrr_95" "matleave_wrr_96" "matleave_wrr_97"
## [28] "matleave_wrr_98" "matleave_wrr_99" "matleave_wrr_00"
## [31] "matleave_wrr_01" "matleave_wrr_02" "matleave_wrr_03"
## [34] "matleave_wrr_04" "matleave_wrr_05" "matleave_wrr_06"
## [37] "matleave_wrr_07" "matleave_wrr_08" "matleave_wrr_09"
## [40] "matleave_wrr_10" "matleave_wrr_11" "matleave_wrr_12"
## [43] "matleave_wrr_13" "bf_dur_95" "bf_dur_96"
## [46] "bf_dur_97" "bf_dur_98" "bf_dur_99"
## [49] "bf_dur_00" "bf_dur_01" "bf_dur_02"
## [52] "bf_dur_03" "bf_dur_04" "bf_dur_05"
## [55] "bf_dur_06" "bf_dur_07" "bf_dur_08"
## [58] "bf_dur_09" "bf_dur_10" "bf_dur_11"
## [61] "bf_dur_12" "bf_dur_13" "mat_bfeed_6mon_95"
## [64] "mat_bfeed_6mon_96" "mat_bfeed_6mon_97" "mat_bfeed_6mon_98"
## [67] "mat_bfeed_6mon_99" "mat_bfeed_6mon_00" "mat_bfeed_6mon_01"
## [70] "mat_bfeed_6mon_02" "mat_bfeed_6mon_03" "mat_bfeed_6mon_04"
## [73] "mat_bfeed_6mon_05" "mat_bfeed_6mon_06" "mat_bfeed_6mon_07"
## [76] "mat_bfeed_6mon_08" "mat_bfeed_6mon_09" "mat_bfeed_6mon_10"
## [79] "mat_bfeed_6mon_11" "mat_bfeed_6mon_12" "mat_bfeed_6mon_13"
## [82] "minage_fem_leg_95" "minage_fem_leg_96" "minage_fem_leg_97"
## [85] "minage_fem_leg_98" "minage_fem_leg_99" "minage_fem_leg_00"
## [88] "minage_fem_leg_01" "minage_fem_leg_02" "minage_fem_leg_03"
## [91] "minage_fem_leg_04" "minage_fem_leg_05" "minage_fem_leg_06"
## [94] "minage_fem_leg_07" "minage_fem_leg_08" "minage_fem_leg_09"
## [97] "minage_fem_leg_10" "minage_fem_leg_11" "minage_fem_leg_12"
## [100] "legal_diff_leg_95" "legal_diff_leg_96" "legal_diff_leg_97"
## [103] "legal_diff_leg_98" "legal_diff_leg_99" "legal_diff_leg_00"
## [106] "legal_diff_leg_01" "legal_diff_leg_02" "legal_diff_leg_03"
## [109] "legal_diff_leg_04" "legal_diff_leg_05" "legal_diff_leg_06"
## [112] "legal_diff_leg_07" "legal_diff_leg_08" "legal_diff_leg_09"
## [115] "legal_diff_leg_10" "legal_diff_leg_11" "legal_diff_leg_12"
## [118] "minage_fem_pc_95" "minage_fem_pc_96" "minage_fem_pc_97"
## [121] "minage_fem_pc_98" "minage_fem_pc_99" "minage_fem_pc_00"
## [124] "minage_fem_pc_01" "minage_fem_pc_02" "minage_fem_pc_03"
## [127] "minage_fem_pc_04" "minage_fem_pc_05" "minage_fem_pc_06"
## [130] "minage_fem_pc_07" "minage_fem_pc_08" "minage_fem_pc_09"
## [133] "minage_fem_pc_10" "minage_fem_pc_11" "minage_fem_pc_12"
## [136] "legal_diff_pc_95" "legal_diff_pc_96" "legal_diff_pc_97"
## [139] "legal_diff_pc_98" "legal_diff_pc_99" "legal_diff_pc_00"
## [142] "legal_diff_pc_01" "legal_diff_pc_02" "legal_diff_pc_03"
## [145] "legal_diff_pc_04" "legal_diff_pc_05" "legal_diff_pc_06"
## [148] "legal_diff_pc_07" "legal_diff_pc_08" "legal_diff_pc_09"
## [151] "legal_diff_pc_10" "legal_diff_pc_11" "legal_diff_pc_12"
## [154] "minwage_ppp_2013" "mw_overtime" "oecd"4.4.3.3 Select variables
由於所需要的資料為第三欄的變數iso3(為國家代碼)和第六至24欄的matleave95~matleave13共29年的資料,所以需要在df[ , ]中選出這幾欄。只要把所要取的欄以vector的型態放在df[row,col]之col的位置,便可以選出所要的欄。程式碼c(3, 6:24)代表取出df的第3欄、第6至24欄。最後,我們將取出來的欄位指給一個新的變數matleave。
# Select the 3rd and 6th to 24th columns
matleave <- df[ , c(3, 6:24)]

# Use class(), dim(), and str() to inspect the data
class(matleave)
## [1] "tbl_df" "tbl" "data.frame"## [1] 197 20## tibble [197 × 20] (S3: tbl_df/tbl/data.frame)
## $ iso3 : chr [1:197] "AFG" "ALB" "DZA" "AND" ...
## $ matleave_95: num [1:197] 2 5 3 2 2 2 2 3 1 5 ...
## $ matleave_96: num [1:197] 2 5 3 2 2 2 2 3 1 5 ...
## $ matleave_97: num [1:197] 2 5 3 2 2 2 2 3 1 5 ...
## $ matleave_98: num [1:197] 2 5 3 2 2 2 2 3 1 5 ...
## $ matleave_99: num [1:197] 2 5 3 2 2 2 2 3 1 5 ...
## $ matleave_00: num [1:197] 2 5 3 3 2 2 2 3 1 5 ...
## $ matleave_01: num [1:197] 2 5 3 3 2 2 2 3 1 5 ...
## $ matleave_02: num [1:197] 2 5 3 3 2 2 2 3 1 5 ...
## $ matleave_03: num [1:197] 2 5 3 3 2 2 2 3 1 5 ...
## $ matleave_04: num [1:197] 2 5 3 3 2 2 2 5 1 5 ...
## $ matleave_05: num [1:197] 2 5 3 3 2 2 2 5 1 5 ...
## $ matleave_06: num [1:197] 2 5 3 3 2 2 2 5 1 5 ...
## $ matleave_07: num [1:197] 2 5 3 3 2 2 2 5 1 5 ...
## $ matleave_08: num [1:197] 2 5 3 3 2 2 2 5 1 5 ...
## $ matleave_09: num [1:197] 2 5 3 3 2 2 2 5 1 5 ...
## $ matleave_10: num [1:197] 2 5 3 3 2 2 2 5 NA 5 ...
## $ matleave_11: num [1:197] 2 5 3 3 2 2 2 5 3 5 ...
## $ matleave_12: num [1:197] 2 5 3 3 2 2 2 5 3 5 ...
## $ matleave_13: num [1:197] 2 5 3 3 2 2 2 5 3 5 ...4.4.3.4 Check & Replace NAs
- 處理開放資料常常會遇到紀錄遺漏的情形,這些遺漏的值在R語言中通常以
NA(Not Available)來表示。這種情況很常見,特別是當數據來自於廣泛的來源,如網絡調查或公開資料庫時。適當處理這些NA值對於維持分析的準確性和可靠性至關重要。 - 為了識別和處理這些
NA值,R提供了一些有用的函數和技巧。例如,is.na(v)函數可以用來檢測向量v中的NA值。如果你想選擇所有的NA紀錄,可以使用v[is.na(v)]這樣的語法。這個表達式會傳回所有在向量v中為NA的元素,這對於進一步的分析和資料清洗非常有幫助。 - 在某些情況下,你可能會想要以某個特定值來取代
NA值,以避免在繪圖或進行其他數據分析時產生錯誤。例如,你可以選擇以0來取代所有的NA值,這可以通過v[is.na(v)] <- 0來實現。這樣,所有原本為NA的資料格都會被賦予0值。 - 此外,
sum(is.na(v))這個表達式可以用來檢測向量v中還有多少NA值。這個函數的運作機制是計算所有is.na(v)為TRUE的情況,即所有NA值的總數。如果這個結果不是0,那麼就表示在向量或dataframe中還存在NA值。這對於確保數據清理工作已經完成,並且數據集準備好進行分析是非常有用的。
##        iso3 matleave_95 matleave_96 matleave_97 matleave_98 matleave_99
##  [1,] FALSE       FALSE       FALSE       FALSE       FALSE       FALSE
##  [2,] FALSE       FALSE       FALSE       FALSE       FALSE       FALSE
##  [3,] FALSE       FALSE       FALSE       FALSE       FALSE       FALSE
##  [4,] FALSE       FALSE       FALSE       FALSE       FALSE       FALSE
##  [5,] FALSE       FALSE       FALSE       FALSE       FALSE       FALSE
##  [6,] FALSE       FALSE       FALSE       FALSE       FALSE       FALSE
##  [7,] FALSE       FALSE       FALSE       FALSE       FALSE       FALSE
##  [8,] FALSE       FALSE       FALSE       FALSE       FALSE       FALSE
##  [9,] FALSE       FALSE       FALSE       FALSE       FALSE       FALSE
## [10,] FALSE       FALSE       FALSE       FALSE       FALSE       FALSE
## [11,] FALSE       FALSE       FALSE       FALSE       FALSE       FALSE
## [12,] FALSE       FALSE       FALSE       FALSE       FALSE       FALSE
## [13,] FALSE       FALSE       FALSE       FALSE       FALSE       FALSE
## [14,] FALSE       FALSE       FALSE       FALSE       FALSE       FALSE
## [15,] FALSE       FALSE       FALSE       FALSE       FALSE       FALSE
## [16,] FALSE       FALSE       FALSE       FALSE       FALSE       FALSE
## [17,] FALSE       FALSE       FALSE       FALSE       FALSE       FALSE
## [18,] FALSE       FALSE       FALSE       FALSE       FALSE       FALSE
## [19,] FALSE       FALSE       FALSE       FALSE       FALSE       FALSE
## [20,] FALSE       FALSE       FALSE       FALSE       FALSE       FALSE
##       matleave_00 matleave_01 matleave_02 matleave_03 matleave_04 matleave_05
##  [1,]       FALSE       FALSE       FALSE       FALSE       FALSE       FALSE
##  [2,]       FALSE       FALSE       FALSE       FALSE       FALSE       FALSE
##  [3,]       FALSE       FALSE       FALSE       FALSE       FALSE       FALSE
##  [4,]       FALSE       FALSE       FALSE       FALSE       FALSE       FALSE
##  [5,]       FALSE       FALSE       FALSE       FALSE       FALSE       FALSE
##  [6,]       FALSE       FALSE       FALSE       FALSE       FALSE       FALSE
##  [7,]       FALSE       FALSE       FALSE       FALSE       FALSE       FALSE
##  [8,]       FALSE       FALSE       FALSE       FALSE       FALSE       FALSE
##  [9,]       FALSE       FALSE       FALSE       FALSE       FALSE       FALSE
## [10,]       FALSE       FALSE       FALSE       FALSE       FALSE       FALSE
## [11,]       FALSE       FALSE       FALSE       FALSE       FALSE       FALSE
## [12,]       FALSE       FALSE       FALSE       FALSE       FALSE       FALSE
## [13,]       FALSE       FALSE       FALSE       FALSE       FALSE       FALSE
## [14,]       FALSE       FALSE       FALSE       FALSE       FALSE       FALSE
## [15,]       FALSE       FALSE       FALSE       FALSE       FALSE       FALSE
## [16,]       FALSE       FALSE       FALSE       FALSE       FALSE       FALSE
## [17,]       FALSE       FALSE       FALSE       FALSE       FALSE       FALSE
## [18,]       FALSE       FALSE       FALSE       FALSE       FALSE       FALSE
## [19,]       FALSE       FALSE       FALSE       FALSE       FALSE       FALSE
## [20,]       FALSE       FALSE       FALSE       FALSE       FALSE       FALSE
##       matleave_06 matleave_07 matleave_08 matleave_09 matleave_10 matleave_11
##  [1,]       FALSE       FALSE       FALSE       FALSE       FALSE       FALSE
##  [2,]       FALSE       FALSE       FALSE       FALSE       FALSE       FALSE
##  [3,]       FALSE       FALSE       FALSE       FALSE       FALSE       FALSE
##  [4,]       FALSE       FALSE       FALSE       FALSE       FALSE       FALSE
##  [5,]       FALSE       FALSE       FALSE       FALSE       FALSE       FALSE
##  [6,]       FALSE       FALSE       FALSE       FALSE       FALSE       FALSE
##  [7,]       FALSE       FALSE       FALSE       FALSE       FALSE       FALSE
##  [8,]       FALSE       FALSE       FALSE       FALSE       FALSE       FALSE
##  [9,]       FALSE       FALSE       FALSE       FALSE        TRUE       FALSE
## [10,]       FALSE       FALSE       FALSE       FALSE       FALSE       FALSE
## [11,]       FALSE       FALSE       FALSE       FALSE       FALSE       FALSE
## [12,]       FALSE       FALSE       FALSE       FALSE       FALSE       FALSE
## [13,]       FALSE       FALSE       FALSE       FALSE       FALSE       FALSE
## [14,]       FALSE       FALSE       FALSE       FALSE       FALSE       FALSE
## [15,]       FALSE       FALSE       FALSE       FALSE       FALSE       FALSE
## [16,]       FALSE       FALSE       FALSE       FALSE       FALSE       FALSE
## [17,]       FALSE       FALSE       FALSE       FALSE       FALSE       FALSE
## [18,]       FALSE       FALSE       FALSE       FALSE       FALSE       FALSE
## [19,]       FALSE       FALSE       FALSE       FALSE       FALSE       FALSE
## [20,]       FALSE        TRUE        TRUE       FALSE       FALSE       FALSE
##       matleave_12 matleave_13
##  [1,]       FALSE       FALSE
##  [2,]       FALSE       FALSE
##  [3,]       FALSE       FALSE
##  [4,]       FALSE       FALSE
##  [5,]       FALSE       FALSE
##  [6,]       FALSE       FALSE
##  [7,]       FALSE       FALSE
##  [8,]       FALSE       FALSE
##  [9,]       FALSE       FALSE
## [10,]       FALSE       FALSE
## [11,]       FALSE       FALSE
## [12,]       FALSE       FALSE
## [13,]       FALSE       FALSE
## [14,]       FALSE       FALSE
## [15,]       FALSE       FALSE
## [16,]       FALSE       FALSE
## [17,]       FALSE       FALSE
## [18,]       FALSE       FALSE
## [19,]       FALSE       FALSE
## [20,]       FALSE       FALSE
# Assign 0 to those NA data
matleave[is.na(matleave)] <- 0
# anyNA() to check if there are still NA cells.
anyNA(matleave)## [1] FALSE## [1] 04.4.3.5 Filtering data
這個階段我希望篩選出2013年(matleave_13)給付等級為5,而1995年(matleave_95)也是5的國家。也就是抽取出有資料記錄以來給付程度就都是最高等級的那群國家,注意,這邊是根據「欄」的資料數值來篩選出合乎條件的「列」。
matleave[matleave$'matleave_13'==5, ]中的第一個matleave表示要篩選的資料集,中括號中的matleave$'matleave_13'==5是篩選條件,表示將篩選matleave資料集中的matleave_13變數值等於5的列;但我同時要滿足第二個條件matleave$'matleave_95',因此要用一個AND符號<span color=“red”>&</span>表示兩個條件必須同時成立。中括號中的逗號後方未有欄位名稱表示將保留所有欄位(變項),僅篩選出符合條件的列,並將篩選後所產生的dataframe指給變數m55。
# Use logical comparison to see if the last year equals to 5
# Assign matching data to var m5
# filter rows by condition
m55 <- matleave[matleave$'matleave_13' == 5 &
                  matleave$'matleave_95' == 5, ]

# nrow() to count matching data
nrow(m55)
## [1] 184.4.4 Plotting
當我們在R中進行資料視覺化時,理解資料結構對於正確使用圖形化函數是非常重要的。以matleave資料集為例,如果我們想要繪製其第二列所有行(除了第一行)的條形圖,預設可以被加入繪製的應該要是數值,所以,
- 首先要除去第一欄。因為第一欄為國家名稱(iso3)。所以,選取第二列資料,但忽略第一欄,應該是
matleave[2, -1]。 - 再來,利用
class(matleave[2, -1])來查看matleave[2, -1]的資料類型。結果會是一個data.frame的資料類型,因為選取單一列時,R仍然保持了資料的data.frame結構。 - 然而,當我們嘗試使用
barplot()函數繪製長條圖時,就不能直接把data.frame給barplot()進行繪製。。這是因為barplot()函數期望的輸入是一個vector。因此,我們使用unlist(matleave[2, -1])將單列的data.frame轉換成vector。unlist()函數的作用是將一個列表(或在這個案例中是data.frame)中的所有元素合併成一個vector,這樣就可以用於barplot()。 - 為了進一步理解這種差異,我們可以使用
class()或str()函數來觀察未經unlist()處理的資料。這將顯示出資料仍然保留在data.frame結構中,與unlist()後轉換為vector的結構不同。這種轉換對於使用某些特定的繪圖函數,如barplot(),是必要的,因為它們需要一個vector作為輸入來正確地繪製圖形。
4.4.4.1 Plotting one row (one country)
# barplot() the second row of m55
# barplot(m55[2, ])       # raise error

# barplot() the second row when neglecting the first column
# barplot(m55[2, -1])     # raise error

# Take a look at the data type of matleave[2, ]
class(matleave[2, -1])
## [1] "tbl_df" "tbl" "data.frame"## [1] "numeric"
Testing
# View(matleave[1]) # select the 1st variable
# View(matleave[ ,1]) # select the 1st column
# View(matleave[1, ]) # select the 1st row

class(m55[1])       # "tbl_df"     "tbl"        "data.frame"
## [1] "tbl_df" "tbl" "data.frame"## [1] "tbl_df" "tbl" "data.frame"## [1] "tbl_df" "tbl" "data.frame"## [1] "character"4.4.4.2 More arguments (args)
接下來我們要微調一下視覺化的結果。這行程式碼使用R中的barplot函數繪製一個長條圖,其中的參數說明如下:
unlist(m55[2, -1]): 將m55資料集的第2行(不包括第1欄)轉換為一個向量,並作為長條圖的高度(即每個長條的高度)。ylim=c(0, 5): 設置y軸的範圍為0到5,即長條圖的最大高度為5。space=0: 設置相鄰兩個長條之間的距離為0,即長條緊密相連。border=NA: 設置長條的邊框為透明,即不顯示邊框。xaxt="n": 不顯示x軸的標籤。yaxt="n": 不顯示y軸的標籤。

# use ?barplot to know more argument of the function.
?barplot

# Add arguments ylim, space, border, and axat/yaxt one by one to barplot()
barplot(unlist(m55[2, -1]), ylim=c(0, 5))


4.4.4.3 Plotting multiple lines
我們已經成功繪製了一個國家的資料,接下來我們要繪出所有國家的資料。以m55這個篩選後的資料為例,我分別要繪製出第1列至第6列的國家。底下可以看見每一行非常相似且一致的特徵,僅有matleave內的索引由1被列出至6。對於這種重複的程式碼,最好的方法是用迴圈(for-loop)的方式將相同的程式碼,從1~6之間做六次。
# plot the first row
barplot(unlist(m55[1, -1]), ylim=c(0, 5), space=0, border=NA, xaxt="n", yaxt="n")
# plot the second to 6th rows
barplot(unlist(m55[2, -1]), ylim=c(0, 5), space=0, border=NA, xaxt="n", yaxt="n")
barplot(unlist(m55[3, -1]), ylim=c(0, 5), space=0, border=NA, xaxt="n", yaxt="n")
barplot(unlist(m55[4, -1]), ylim=c(0, 5), space=0, border=NA, xaxt="n", yaxt="n")
barplot(unlist(m55[5, -1]), ylim=c(0, 5), space=0, border=NA, xaxt="n", yaxt="n")
barplot(unlist(m55[6, -1]), ylim=c(0, 5), space=0, border=NA, xaxt="n", yaxt="n")
4.4.4.4 for-loop to plot multiple lines
這段R語言程式碼使用for-loop來重複執行一個指定的程式區塊,將m55資料集的前六行資料分別繪製成長條圖。在這段程式碼中,變數i控制了for-loop的迭代次數,它從1到6依次取值,然後依次執行所指定的程式區塊。
一般的for-loop的結構如下:for (variable in sequence) {# code block to be executed}。其中,變數variable是用來控制for-loop的迭代次數的,它會從序列sequence中逐一取出元素,並將其賦值給變數variable,然後執行大括號{...}中所指定的程式區塊。
# use for loop and use i as index to barplot multiple subgraphs
for(i in 1:6){
  barplot(unlist(m55[i, -1]), ylim=c(0, 5), space=0, border=NA, xaxt="n", yaxt="n")
}

4.4.4.5 Subplots
但這樣一個國家就要畫成一個Plot,如果要將多個國家、也就是多個Plots繪製在同一張圖上的話,R也有支援Subplot的函式與設定。在R語言中,par(parameter的縮寫)是一個用於設置繪圖參數的函數,通過它可以控制繪圖的外觀、尺寸、排列等各方面,以便更好地展示數據和分析結果。par函數可以用來設置以下參數:
mfrow:設置畫布的分割,即將畫布分為多少行和多少列,例如mfrow=c(3,2)代表三列二行。mai:設置畫布的邊緣大小,包括上下左右四個邊緣的大小。cex:設置字體大小的縮放比例。col:設置線條、點和字體的顏色。pch:設置散點圖中點的形狀。lty:設置線條的類型。
在這段程式碼中,par函數被用來設置畫布的分割和邊緣大小,具體來說,par(mfrow=c(3,2), mai= c(0.2, 0.2, 0.2, 0.2))表示將畫布分為3行2列的子圖,並設置邊緣大小為0.2,包括上下左右四個邊緣。這樣可以方便地在同一張畫布上顯示多個圖形,並控制它們之間的排列和間距。
# use ?par to get more plotting parameters
?par

# use par() to set-up the layout of subgraphs
# use the parameter main=c(0.2, 0.2, 0.2, 0.2) to thrink the padding of figures.
par(mfrow=c(3,2), mai= c(0.2, 0.2, 0.2, 0.2))
for(i in 1:6){
  barplot(unlist(m55[i, -1]), ylim=c(0, 5), space=0, border=NA, xaxt="n", yaxt="n")
}
我用nrow(m55)來取得m55這個data.frame共有多少個國家,然後,我讓for-loop從1:nrow(m55)相當於繪製完所有m55中的子圖。注意我修改了mfrow為mfrow=c(4, 6)。
## [1] 18# use par() to set-up plotting parameters.
par(mfrow=c(4, 6), mai= c(0.2, 0.2, 0.2, 0.2))
# use for-loop to plot all graph as subgraph
for (i in 1:nrow(m55)){
barplot(unlist(m55[i, -1]), border=NA, space=0, xaxt="n", yaxt="n", ylim = c(0,5))
}
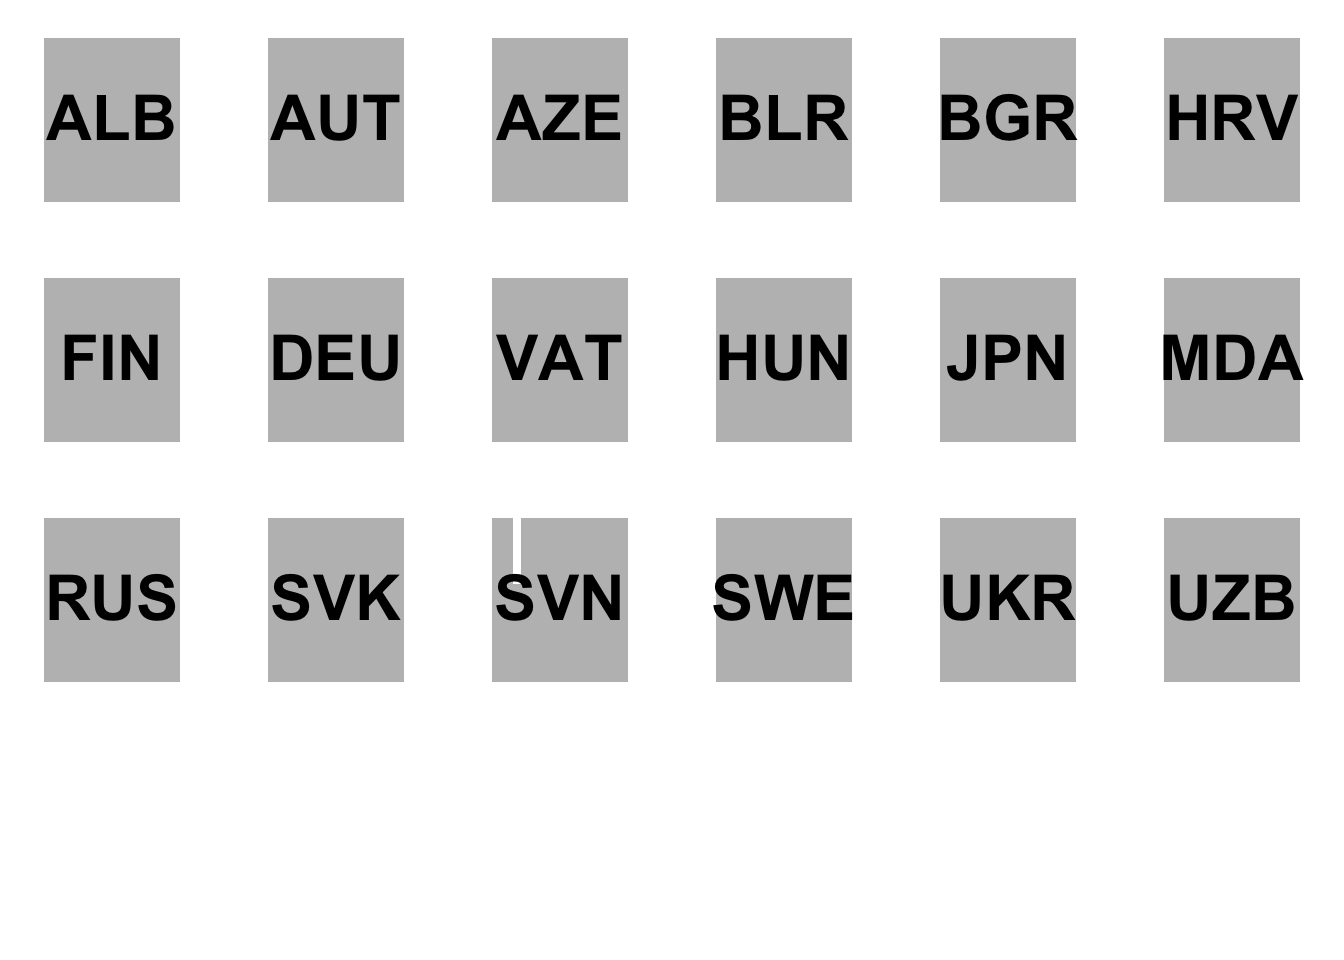
在每個子圖上,我要加上每個國家的國別代碼iso3,也就是m55的第一行如m55[i,1],我用同樣的i來掃過每一列,繪製完barplot()後,便用title()函式來繪製文字。結果如下。注意我的設定title(m55[i,1], line = -4, cex.main=3)。line為繪製文字的基線,而cex.main是字型大小。
par(mfrow=c(4,6), mai= c(0.2, 0.2, 0.2, 0.2))
for (i in 1:nrow(m55)){
  barplot(unlist(m55[i, -1]), border=NA, space=0,xaxt="n", yaxt="n", ylim = c(0,5))
    title(m55[i,1], line = -4, cex.main=3)
}
4.4.5 Practice. Plotting more
- 繪製
m05的資料,也就是matleave_95!=5但matleave_13==5的資料。 - 繪製
m04的資料,也就是matleave_95!=4但matleave_13==4的資料。 - 繪製
m44的資料,也就是matleave_95==4但matleave_13==4的資料。
4.4.6 Practice. Selecting and filtering by dplyr I
請嘗試問問ChatGPT,如果將以下程式碼改為dplyr的寫法,要怎麼寫。
df <- read_excel("data/WORLD-MACHE_Gender_6.8.15.xls", "Sheet1", col_names=T)

# select columns by index
# matleave <- df[ , c(3, 6:24)]

# select all NA cells and assign 0 to them
# matleave[is.na(matleave)] <- 0

# filter rows by condition
# m5 <- matleave[matleave$'matleave_13' == 5, ]

# filter rows by condition
# m55<- m5[m5$'matleave_95' == 5,]

# plot
par(mfrow=c(4,6), mai= c(0.2, 0.2, 0.2, 0.2))
for (i in c(1:nrow(m55))){
    barplot(unlist(m55[i,-1]),
            border=NA, space=0,xaxt="n", yaxt="n", ylim = c(0,5))
    title(m55[i,1], line = -4, cex.main=3)
}
4.4.7 (More) Clean version
# readxl::read_excel() to import the xls file
library(readxl)

df <- read_excel("data/WORLD-MACHE_Gender_6.8.15.xls", "Sheet1", col_names=T)

# select iso3, and matleave columns by index
matleave <- df[ , c(3, 6:24)]

# str() to inspect the data structure of
str(matleave)
## tibble [197 × 20] (S3: tbl_df/tbl/data.frame)
## $ iso3 : chr [1:197] "AFG" "ALB" "DZA" "AND" ...
## $ matleave_95: num [1:197] 2 5 3 2 2 2 2 3 1 5 ...
## $ matleave_96: num [1:197] 2 5 3 2 2 2 2 3 1 5 ...
## $ matleave_97: num [1:197] 2 5 3 2 2 2 2 3 1 5 ...
## $ matleave_98: num [1:197] 2 5 3 2 2 2 2 3 1 5 ...
## $ matleave_99: num [1:197] 2 5 3 2 2 2 2 3 1 5 ...
## $ matleave_00: num [1:197] 2 5 3 3 2 2 2 3 1 5 ...
## $ matleave_01: num [1:197] 2 5 3 3 2 2 2 3 1 5 ...
## $ matleave_02: num [1:197] 2 5 3 3 2 2 2 3 1 5 ...
## $ matleave_03: num [1:197] 2 5 3 3 2 2 2 3 1 5 ...
## $ matleave_04: num [1:197] 2 5 3 3 2 2 2 5 1 5 ...
## $ matleave_05: num [1:197] 2 5 3 3 2 2 2 5 1 5 ...
## $ matleave_06: num [1:197] 2 5 3 3 2 2 2 5 1 5 ...
## $ matleave_07: num [1:197] 2 5 3 3 2 2 2 5 1 5 ...
## $ matleave_08: num [1:197] 2 5 3 3 2 2 2 5 1 5 ...
## $ matleave_09: num [1:197] 2 5 3 3 2 2 2 5 1 5 ...
## $ matleave_10: num [1:197] 2 5 3 3 2 2 2 5 NA 5 ...
## $ matleave_11: num [1:197] 2 5 3 3 2 2 2 5 3 5 ...
## $ matleave_12: num [1:197] 2 5 3 3 2 2 2 5 3 5 ...
## $ matleave_13: num [1:197] 2 5 3 3 2 2 2 5 3 5 ...# select all NA cells and assign 0 to them
matleave[is.na(matleave)] <- 0
# filter rows by condition
m55 <- matleave[matleave$'matleave_13' == 5 & matleave$'matleave_95' == 5, ]
# plot
par(mfrow=c(4,6), mai= c(0.2, 0.2, 0.2, 0.2))
for (i in c(1:nrow(m55))){
barplot(unlist(m55[i,-1]),
border=NA, space=0,xaxt="n", yaxt="n", ylim = c(0,5))
title(m55[i,1], line = -4, cex.main=3)
}