Chapter 22 ggplot
本節著重在介紹ggplot的基本概念與設定。
小訣竅:可在一開始便透過knitr::opts_chunk$set(echo = TRUE, fig.width = 2, fig.asp = 0.4)來一次設定所有圖片。fig.width = 8與fig.height = 6 是以英吋(inches)為單位,或用fig.dim = c(8, 6)一次設定長寬1。echo = TRUE是設定knit出輸出格式(如html)時,也要包含程式碼。如果echo = FALSE的話,就只會輸出文字和圖形。
22.1 Essentials of ggplot
用ggplot來繪製圖形有三個基本函式ggplot() + aes() + geom_圖表類型。
- 指定要進行繪圖
ggplot():用%>%將資料(dataframe)pipe給ggplot()後,底下各增添的繪圖選項都用+的符號,類似不斷修正繪圖結果的意思。 - 指定X/Y軸與群組因子
aes():指定圖表的X/Y軸分別是什麼變數,有些圖表只需要單一個變數(例如Density-chart和Histogram),有些需要X/Y兩個變數(例如Scatter-chart)什麼的變數要做視覺化,Boxplot甚至可以直接指定最大、最小、Q1、Q3和Median等多個變數。 - 指定要繪製的圖表類型。例如Line-chart為
geom_line()、Scatter-chart為geom_point()、Bar-chart為geom_col()或geom_bar()。查閱ggplot cheat sheet可以快速翻閱有哪些圖表類型(如截圖)。
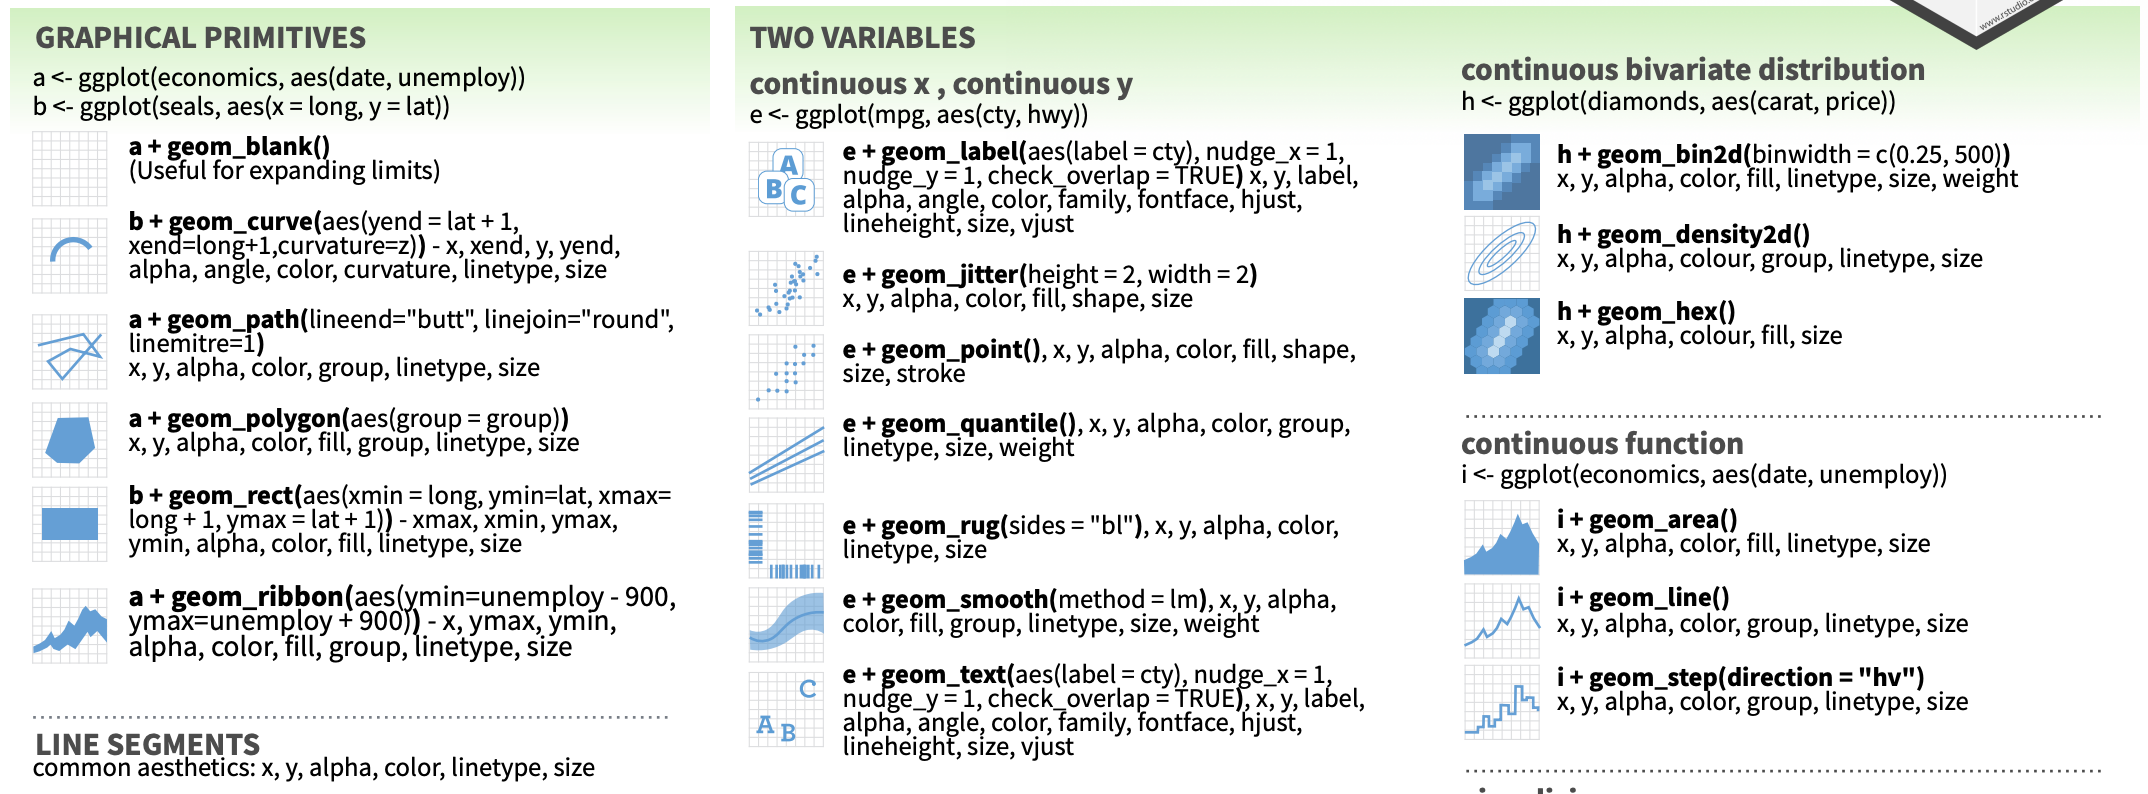
22.1.3 (3) geom_???() 指定要繪製的圖表類型。
例如折線圖為為geom_line()、X/Y散佈圖為geom_point()、長條圖我多會使用geom_col()。ggplot繪圖種類除了可以參照前面的ggplot cheat sheet之外,可以詢問ChatGPT有哪些常見的類別,甚至可以請他舉例給你測試該繪圖方法。

亦可同時繪製兩種類型的圖表於同一張圖上。例如以下同時繪製了geom_line()與geom_plot()。

注意:ggplot是以變數為基礎的視覺化套件,也就是說,當準備好dataframe後,就可以在ggplot中指定要用哪些變數來繪圖。也因此,務必把dataframe整理為tidy型態,也就是長表格(long-form)的型態。整理完資料後,我會習慣地用names(plot)或glimpse(plot)來看一下該資料所有的變項,好可以在下一階段的繪圖做參考。
22.2 NYT: Inequality
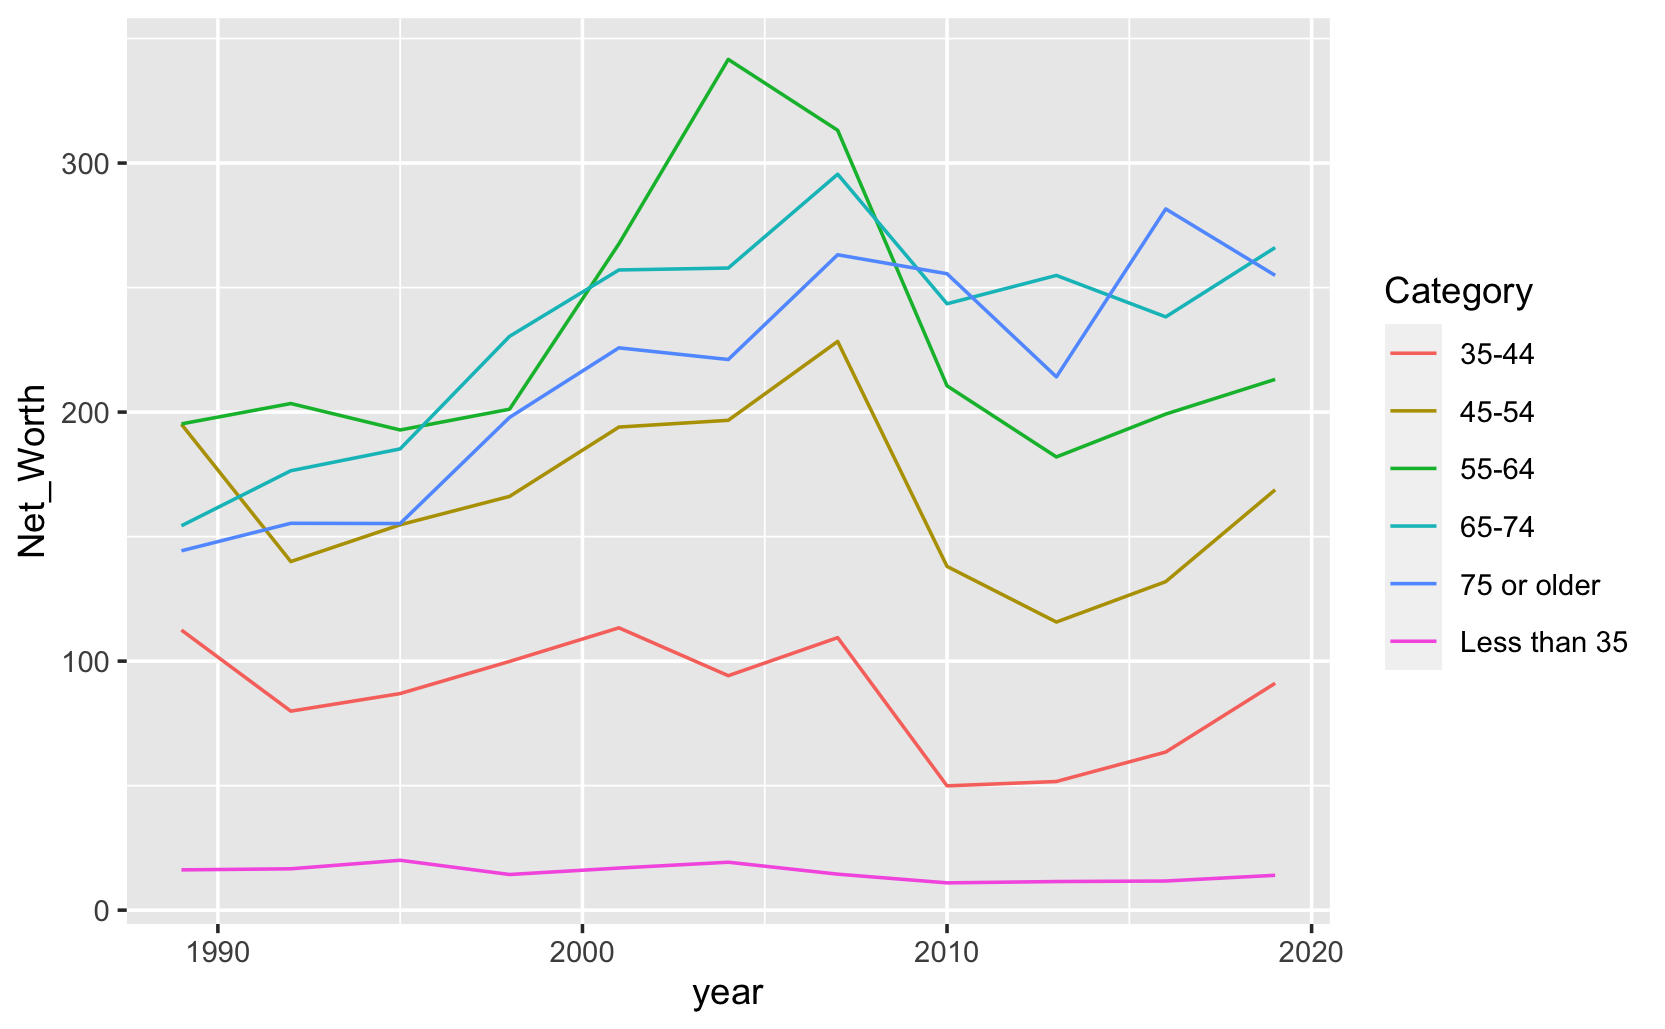
以下將以紐時的這個Teach About Inequality With These 28 New York Times Graphs 案例來做繪圖教學。該教學引用了Opinion | America Will Struggle After Coronavirus. These Charts Show Why.這篇新聞中的圖表,我們拿來做範例的這張圖,主要是在說財富趨勢對年輕人而言尤其艱難。35歲以下美國人的凈資產中位數 - 他們平均比年長的美國人差得多 - 比2004年35歲以下美國人的凈資產低40%。相比之下,65歲以上美國人的凈資產在同一時期增長了9%。簡而言之,嬰兒潮一代比他們的前輩更富有,而千禧一代和X世代比他們的前輩更窮;或者說,年輕人拿自己和10年前的年輕人相比,現在的年輕人更窮;而現在的老年人拿自己和10年前的老年人比,現在的老年人更富有。
22.2.1 (1) Loading data
仔細觀察一下資料,你會怎樣描述這個資料?
這個Dataframe包含三個變數(Category, year, Net_Worth),共66個觀測值。變數「Category」描述的是年齡範圍,包含六個類別(Level)。變數「year」代表年份,從1989年到2019年,以三年為一個週期觀察,共有11個Levels。變數「Net_Worth」則表示在該年齡範圍內的淨資產。從資料可以觀察到,在不同的時間點,不同年齡範圍的人群的財富狀況看似有明顯差異。例如,比較1989年和2019年,45-54歲的年齡組在這段期間內的淨值似乎較35-44歲組要高,這可能反映了隨著年齡增長,個人或家庭的財富累積增加的趨勢。
NW <- read_csv("data/interactive_bulletin_charts_agecl_median.csv") %>%
    select(Category, year, Net_Worth)  %>%
    group_by(Category) %>%
    arrange(year) %>%
    ungroup()
## Rows: 66 Columns: 37
## ── Column specification ────────────────────────────────────────────────────────
## Delimiter: ","
## chr (1): Category
## dbl (36): year, Before_Tax_Income, Net_Worth, Assets, Financial_Assets, Tran...
##
## ℹ Use `spec()` to retrieve the full column specification for this data.
## ℹ Specify the column types or set `show_col_types = FALSE` to quiet this message.## # A tibble: 12 × 3
## Category year Net_Worth
## <chr> <dbl> <dbl>
## 1 Less than 35 1989 16.2
## 2 35-44 1989 112.
## 3 45-54 1989 195.
## 4 55-64 1989 195.
## 5 65-74 1989 154.
## 6 75 or older 1989 144.
## 7 Less than 35 1992 16.6
## 8 35-44 1992 79.9
## 9 45-54 1992 140.
## 10 55-64 1992 203.
## 11 65-74 1992 176.
## 12 75 or older 1992 155.22.2.1.1 (1.1) group_by()的概念
在提供的程式碼中,group_by(Category)是一個關鍵步驟,它影響了數據處理的方式,尤其是在隨後的操作中。以下是有和沒有group_by(Category)時的主要差異:
有
group_by(Category):當在程式碼中使用group_by(Category)時,這意味著接下來的操作將在每個Category類別的子集上單獨進行。這對於需要按類別分析或操作數據時非常有用。在此程式碼中,arrange(year)將會在每個Category內部對year進行排序。這意味著每個類別內的年份會從最小到最大排序,但這種排序是獨立於其他類別的。沒有
group_by(Category):如果省略group_by(Category),則後續的操作將考慮所有的數據作為一個整體來進行。省略
group_by(Category)後,arrange(year)會對整個數據集按year進行全局排序,而不會考慮Category的界限。由於year是一個類別變項,出現在多個Category組中,因此,會有多個相同year的列排在一起。
22.2.2 (2) Visualizing
這是預期視覺化的結果。
22.2.2.1 (2.1) Plot without group
先將year和Net_worth分別繪製在X與Y軸上,並用geom_line()繪製為折線圖。結果圖表中呈現鋸齒狀的折線,看似有問題,但其實是合理的。因為year是一個離散變數,而我們希望每個年齡層一條線的話,那就要照年齡層來分組。也因此,每一年都有有每個年齡層的資料,當我們把「年」作為X軸時,自然同一年就會有數筆不同年齡層的資料,因此才會是鋸齒狀的。

不同的圖表類型是可以疊加在同一張圖上的。我們也可以把geom_point() 另一種圖表型態加入,也是可以的,兩者的X與Y不相衝突。geom_line()、geom_point()、geom_text()三者會經常伴隨出現。

22.2.2.2 (2.2) Grouping
上圖是我們把多個年齡層的逐年資料畫在同一條折線上,所以會呈現鋸齒狀折現的狀況。但這些年齡層並非在同一條線上呀?因此,我們要根據Category這個變數來做分組。
NW %>%
    ggplot() +
    aes(x=year, y=Net_Worth, group=Category) +
    geom_line() +
    geom_point(stat="identity")
如希望不同線條上不一樣的色彩,應指定color=Category。

- 用color、fill或group來做分組?
-
在使用
geom_line()函數時,顏色的設定是針對線條本身,而非填充面積。當我們希望指定點(透過geom_point())或線條(使用geom_line())的顏色時,我們會使用color參數來定義顏色。
相對地,當使用`geom_area()`函數進行視覺化時,由於它涉及的是面積的填充,因此我們應該使用`fill`參數來指定填充色。在某些情況下,我們可能會同時使用`color=Category`和`fill=Category`來對`geom_area()`進行設定,這樣做能夠同時定義邊線顏色和填充顏色。然而,當利用`geom_area()`來展示折線圖時,建議限制使用的顏色種類不超過兩種,以避免顏色層疊導致的視覺混淆,即便是設定了`alpha=0.2`以降低透明度。
`geom_area()`函數默認展示的是累積分佈圖,即不同群組的數值會在Y軸方向上疊加。若目的是比較兩個群組之間的差異,而非觀察整體趨勢,則可以通過添加`position="dodge"`參數來調整分佈方式,並將`alpha`設定為小於1的值以增加圖形的透明度,從而更清晰地分辨不同群組之間的差異。NW %>%
ggplot() + aes(year, Net_Worth, color=Category, fill=Category) +
geom_area(position="dodge", alpha=0.2)
22.3 Adjusting Chart
22.3.1 Type of Points and Lines
下面的例子同時用了geom_line()和geom_point(),且分別設定了線寬(size=1)、點的大小(size=2),折線型態(linetype="dashed")、半透明程度(alpha)。
ggplot2 line types : How to change line types of a graph in R software? - Easy Guides - Wiki - STHDA
NW %>%
ggplot() + aes(year, Net_Worth, color=Category) +
geom_line(size=1, linetype = "dashed", alpha=0.5) +
geom_point(size=2, color="dimgrey", alpha=0.5)## Warning: Using `size` aesthetic for lines was deprecated in ggplot2 3.4.0.
## ℹ Please use `linewidth` instead.
## This warning is displayed once every 8 hours.
## Call `lifecycle::last_lifecycle_warnings()` to see where this warning was
## generated.
22.3.2 Line Types
See more from ggthemes https://github.com/BTJ01/ggthemes/tree/master/inst/examples
library(ggthemes)
rescale01 <- function(x) {
(x - min(x)) / diff(range(x))
}
gather(economics, variable, value, -date) %>%
group_by(variable) %>%
mutate(value = rescale01(value)) %>%
ggplot(aes(x = date, y = value, linetype = variable)) +
geom_line() +
scale_linetype_stata() + theme_minimal()
22.3.3 Title, Labels and Legends
Titles, labels, and legend 設定標題與X/Y軸標題(法一):以下設定了圖表的圖表標題、和X軸與Y軸的軸標題(xlab與ylab)。
NW %>%
    ggplot() + aes(year, Net_Worth, color=Category) +
geom_line() +
theme_minimal() +
xlab("Year") +
ylab("Net Worth") +
ggtitle("Net Worth by year grouped by age groups")
設定標題與X/Y軸標題(法二):這是一次設定圖表標題(title)、次標題(suttitle)、X軸與Y軸標題的方法。
NW %>%
    ggplot() + aes(year, Net_Worth, color=Category) +
    geom_line() +
    theme_minimal() +
    labs(title = "Net Worth by year grouped by age groups",
         subtitle = "Source from: ...",
         x = "Year",
         y = "Net Worth")
調整X軸與Y軸標題位置的:必須要透過theme()來設定axis.title.x = element_text(hjust=1)。
NW %>%
    ggplot() + aes(year, Net_Worth, color=Category) +
    geom_line() +
    theme_minimal() +
    labs(title = "Net Worth by year grouped by age groups",
         x = "Year",
         y = "Net Worth") +
    theme(axis.title.x = element_text(hjust=1),
          axis.title.y = element_text(hjust=1))
去除X/Y軸標題(不佳):直接將空字串Assign給title、x、與y即可。
NW %>%
    ggplot() + aes(year, Net_Worth, color=Category) +
    geom_line() +
    theme_minimal() +
    labs(title = "", x = "", y = "")
去除X/Y軸標題(較佳):透過設定theme()來調整。可發現透過這種設定方法,原本標題和X/Y軸標題的邊界空間就會被釋放出來。
# No extra space for xlab, ylab and title
NW %>%
    ggplot() + aes(year, Net_Worth, color=Category) +
    geom_line(show.legend = F) +
    theme_minimal() +
    theme(plot.title = element_blank(),
          axis.title.x = element_blank(),
          axis.title.y = element_blank())
22.3.4 Font
調整字型會建議都從theme()來做調整,所有圖面上看得到的字都有相對應的變數可以調整字型。例如以下的例子中,把標題的字型大小調整為14粗體、X與Y軸的字型則調整了向右對齊、10粗斜體、顏色為dimgrey。
NW %>%
    ggplot() + aes(year, Net_Worth, color=Category) +
    geom_line() +
    theme_minimal() +
    labs(title = "Net Worth by year grouped by age groups",
         x = "Year",
         y = "Net Worth") +
    theme(plot.title = element_text(size=14, face="bold"),
          axis.title.x = element_text(hjust=1, size=10,
                                      color="dimgrey",
                                      face="bold.italic"),
          axis.title.y = element_text(hjust=1, size=10,
                                      color="dimgrey",
                                      face="bold.italic")
          )
22.3.5 Color Themes
ggplot也有其圖表主題色調。之前範例的灰色圖表背景就是預設的主題,ggplot中還有好幾個預設圖表主題可以選,例如theme_minimal()或theme_tw()等等。
- Modify components of a theme — theme • ggplot2 (tidyverse.org)
- bbplot/bbc_style.R at master · bbc/bbplot (github.com)

22.3.6 Set-up Default Theme
如果希望所有的圖表都有一致的顏色和排版的調性,可以在一開始編輯Rmd的時候就設計好一套theme()並指給一個變數(例如以下的th)。
th <- theme(plot.title = element_text(size=14, face="bold"),
          axis.title.x = element_text(hjust=1, size=10,
                                      color="dimgrey",
                                      face="bold.italic"),
          axis.title.y = element_text(hjust=1, size=10,
                                      color="dimgrey",
                                      face="bold.italic")
          )

NW %>%
    ggplot() + aes(year, Net_Worth, color=Category) +
    geom_line(linetype = "dashed", alpha=0.5) +
    geom_point(size=2, color="dimgrey", alpha=0.5) +
    theme_minimal() +
    labs(title = "Net Worth by year grouped by age groups",
         x = "Year",
         y = "Net Worth") + th
22.3.7 Show Chinese Text
Python和R這些程式語言的預設視覺化套件都沒辦法顯示中文,所以如果要顯示中文的話,就要指定圖表標題、X、Y軸標籤、圖說和各個部件的字型。因為我在Mac上繪圖,所以我將字型指定為Heiti TC Light。如果想知道自己的電腦上有什麼可以用,可以到電腦的字體簿上查找中文字體名稱,或者上網google「ggplot 中文字型選擇」。

county <- read_csv("data/tw_population_opendata110N010.csv") %>%
    slice(-1, -(370:375)) %>%
    type_convert() %>%
    mutate(county = str_sub(site_id, 1, 3)) %>%
    group_by(county) %>%
    summarize(
        area = sum(area),
        people_total = sum(people_total)
    ) %>%
    ungroup()
## Rows: 375 Columns: 5
## ── Column specification ────────────────────────────────────────────────────────
## Delimiter: ","
## chr (5): statistic_yyy, site_id, people_total, area, population_density
##
## ℹ Use `spec()` to retrieve the full column specification for this data.
## ℹ Specify the column types or set `show_col_types = FALSE` to quiet this message.
##
## ── Column specification ────────────────────────────────────────────────────────
## cols(
## statistic_yyy = col_double(),
## site_id = col_character(),
## people_total = col_double(),
## area = col_double(),
## population_density = col_double()
## )下面這是一個長條圖的範例(barplot,不是histogram)。Barplot可以直接指定X軸為縣市(county)和Y軸為總人口數(people_total),但是要用geom_col()而非geom_bar()。除此之外,Bar的顏色有「面」的特徵,所以若要自訂整條bar的顏色,要用fill而非color,color只會是每條Bar的外框。
county %>%
    arrange(desc(people_total)) %>%
    ggplot() + aes(county, people_total) %>%
    geom_col(fill="lightgrey", color="black") +
    theme_minimal() +
    theme(axis.text.x = element_text(family="Heiti TC Light"))
舉例來說,中文字型可以是標楷體(BiauKai)、宋體(Songti TC)、黑體(Heiti TC Light)、蘋方(PingFang TC)、Noto(Noto Sans CJK TC)
th <-
  theme(title = element_text(family="Heiti TC Light"),
        text = element_text(family="Heiti TC Light"),
        axis.text.y = element_text(family="PingFang TC"),
        axis.text.x = element_text(family="Heiti TC Light"),
        legend.text = element_text(family="Heiti TC Light"),
        plot.title = element_text(family="Heiti TC Light")
        )
county %>%
  ggplot() + aes(county, people_total) %>%
  geom_col(fill="skyblue") +
  theme_minimal() + th +
  theme(axis.text.x = element_text(angle = 45))
22.3.8 X/Y axis
調整圖表方向
county %>%
  ggplot() + aes(county, people_total) %>%
  geom_col(fill="skyblue") +
  coord_flip() +
  theme_minimal() + th +
theme(axis.text.x = element_text(angle = 45))-1.png)
通常coord_flip()後往往會希望這些bar會是由上而下排序好的,但用arrange(desc(people_total)是無法解決問題的,因為Y軸原本會是照Y軸的刻度排列,而不是Y軸的數值。所以,要被排序的應該是Y軸的「文字」也就是那些縣市。因此,我們需要將該縣市轉為factor(1~n),並且讓這些縣市被安排的factor數值照people_total排列,因此要用mutate(county = reorder(county, people_total))。reorder()是一個將文字轉factor的函式,但在此特別指定照people_total的編排。
county %>%
  # arrange(desc(people_total) %>%
  mutate(county = reorder(county, people_total)) %>%
  ggplot() + aes(county, people_total) %>%
  geom_col(fill="skyblue") +
  coord_flip() +
  theme_minimal() + th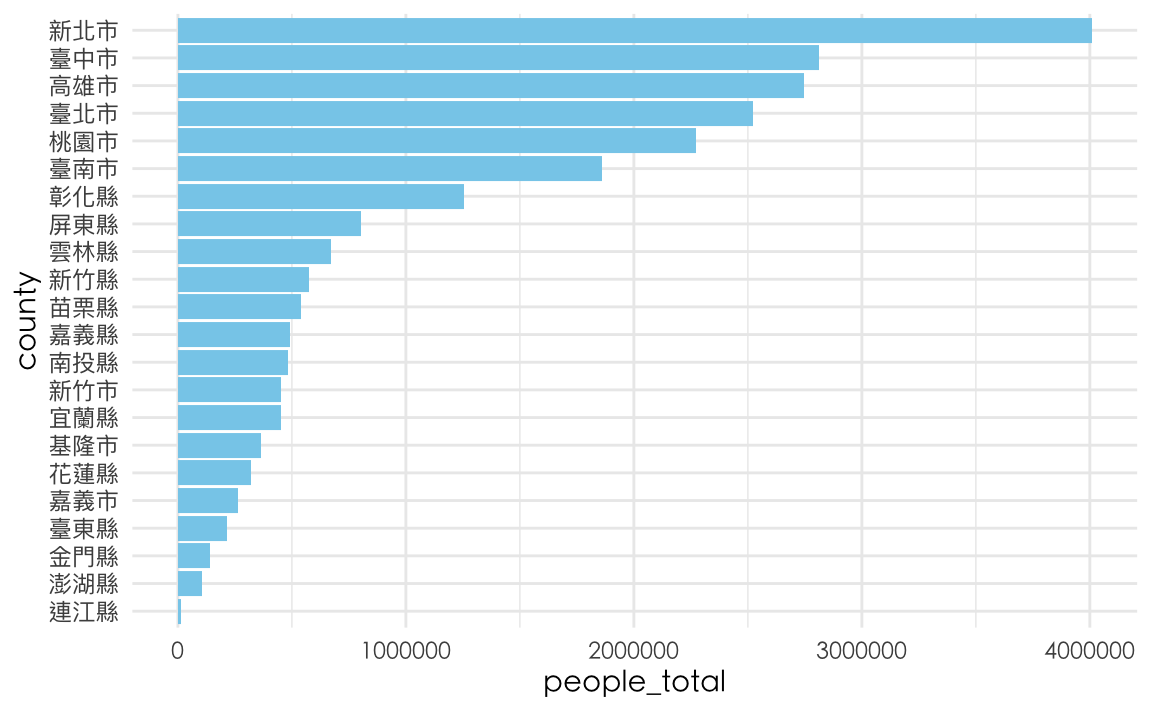
22.4 Highlighting & Storytelling
「說故事」才是整則資料新聞的核心,在運用圖表來輔助敘事時,應搭配說理說服的內容來突顯(highlight)圖面上的特徵,而不是留待讀者自己觀察。以下有三種highlight圖表部分資料的方法。第一個方法是在繪圖時用+ scale_color_manual()或+ scale_fill_manual()指定顏色給不同群組;方法二是利用gghighlight這個套件來指定要上色的群組,而且gghighlight可以和fill與color相互搭配,仍然可以用scale_fill_manual和scale_color_manual來指定顏色。但會有個狀況是,如果原本沒群組那怎麼辦?就自己用mutate()打造群組就好。方法各有利弊與使用時機。
22.4.1 依群組指定顏色
scale_color_manual() 與scale_fill_manual()
NW %>%
    ggplot() + aes(year, Net_Worth, color = Category) +
    geom_line() +
    scale_color_manual(
        limits=c("65-74", "35-44"),   # original chart group
        values=c("gold", "skyblue"),  # map to color
        name="Age group",             # legend title
        breaks=c("65-74", "35-44"),   # original legend group labels
        labels=c("elder(65-74)","younger(35-44)"), # map to new labels
        na.value = "lightgrey" # color for other groups
        ) +
    theme_minimal()
22.4.2 使用gghighlight套件
library(gghighlight)
NW %>%
    ggplot() + aes(year, Net_Worth, color = Category) +
    geom_line() +
    gghighlight(Category %in% c("65-74", "35-44")) +
    theme_minimal() +
    scale_x_continuous(breaks = NULL) +
    theme(panel.background = element_rect(fill = "whitesmoke",
                                colour = "whitesmoke",
                                size = 0.5, linetype = "solid"))
使用gghighlight仍能自己使用scale_color_manual()來指定顏色
NW %>%
    ggplot() + aes(year, Net_Worth, color = Category) +
    geom_line() +
    gghighlight(Category %in% c("65-74", "35-44")) +
    scale_color_manual(
        limits=c("65-74", "35-44"),   # original chart group
        values=c("gold", "skyblue")) +   # map to color
    theme_minimal()
## Warning: Tried to calculate with group_by(), but the calculation failed.
## Falling back to ungrouped filter operation...## label_key: Category
22.4.3 為視覺化建立群組
這個方法是在原本的資料並沒有可以作為color或fill的因子,所以自行創建一個要突顯的群組。
county %>%
  mutate(group = if_else(county %in% c("新竹縣", "新竹市"), "highlight", "other")) %>%
  mutate(county = reorder(county, people_total)) %>%
  ggplot() + aes(county, people_total, fill=group) %>%
  geom_col() +
  scale_fill_manual(values=c("highlight"="Khaki", "other"="lightgrey")) +
  guides(fill="none") +
  coord_flip() +
  theme_minimal() + th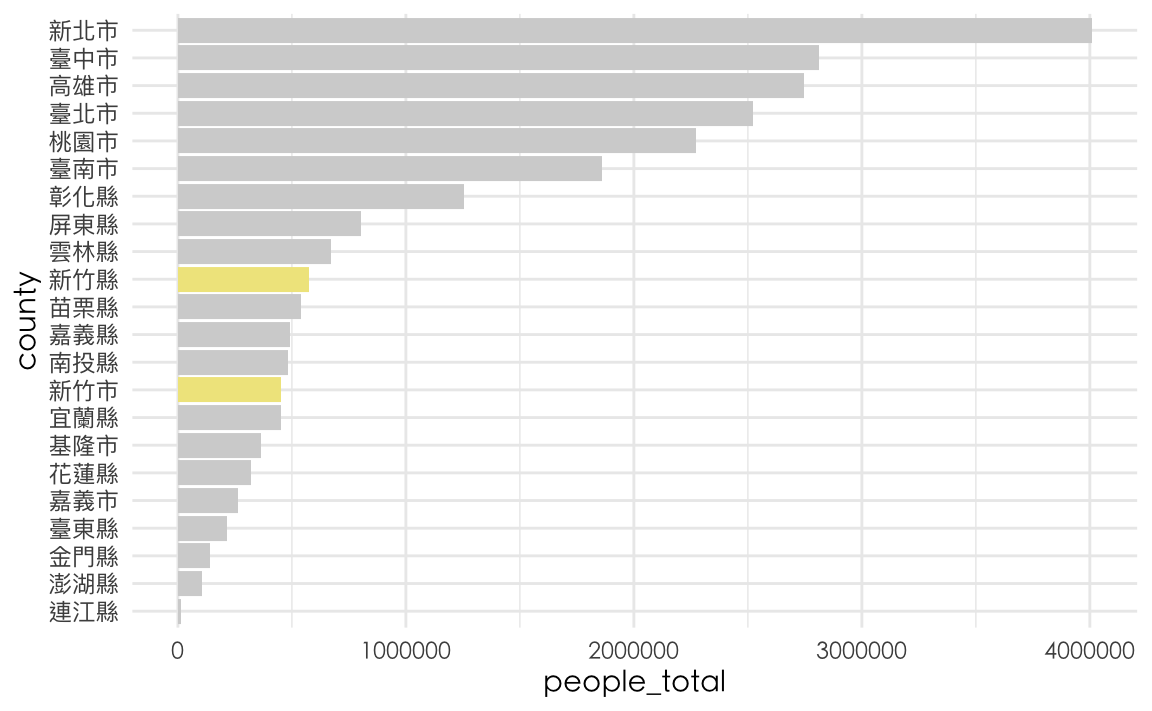
但事實上也可以用gghighlight直接達成
county %>%
    mutate(county = reorder(county, people_total)) %>%
    ggplot() + aes(county, people_total) %>%
    geom_col(fill="deeppink") +
    gghighlight(county %in% c("新竹縣", "新竹市")) +
    guides(fill="none") +
    coord_flip() +
    theme_minimal() + th

