Chapter 31 Interactivity
31.1 ggplotly
Scatter plots with ggplot2 (plotly.com)
31.1.1 LINE CHART
Line plots with R (plotly.com)
NW <- read_csv("data/interactive_bulletin_charts_agecl_median.csv") %>%
    select(Category, year, Net_Worth)  %>%
    group_by(Category) %>%
    arrange(year) %>%
ungroup()如果希望滑鼠在移到折線上時就會有浮出的資訊(tips)顯示該資料點的屬性特徵,可以採用plotly()這個套件。這個套件原本就是做線上互動圖表的,但他開發了R client讓R的使用者可以很輕易地把ggplot2的結果轉為互動圖表。但這所謂的互動也僅限於滑鼠移過去所浮出的資訊罷了,不過已經能夠達到吸引部分讀者目光、提供訊息的效果。
而plotly的設計非常簡單,就是把ggplot的結果指給一個變數後,然後用ggplotly(NW.plot)將其轉為plotly即可。但要注意的是,並不是每一個圖都可以順利轉換。例如本節最後一個例子Treemap便無法成功轉換。
設定:原本plotly會帶一個操控列,可以在ggplotly()指令後加入config()便可將其隱藏。
NW.plot <- NW %>%
    ggplot() +
    aes(year, Net_Worth, color=Category) +
    geom_line() +
    theme_minimal() +
    labs(title = "Net Worth by year grouped by age groups",
         x = "Year",
         y = "Net Worth") + th

library(plotly)
ggplotly(NW.plot) %>%
config(displayModeBar = FALSE)可以在aes()設定要帶入圖的變數時,新增一個text變數,手動設定要呈現的動態呈現方塊。但要注意的是,要多加入一個group=1才能夠作用(WHY?)。但前例浮出視窗的原始內容所顯示的是原本的變數名稱和值,往往不易觀察。比較好的方式是在下ggplot() + aes()指令時,在aes()中指定text來作為後續浮出視窗內容。指定方法如下。要注意的是,該浮出視窗的語法是HTML,所以如果要改寫浮出視窗內容,要用paste0()將變數和HTML的標籤給銜接起來。以下例子中的<b>代表粗體的意思,<br>則是換行符號。
NW.plot <- NW %>%
    ggplot() +
    aes(year, Net_Worth,
        color=Category,
        text = paste0("<b>年(X): </b>", year, "<br>",
                      "<b>淨資產(Y): </b>", Net_Worth,"<br>",
                      "<b>年齡組: </b>", Category),
        group=1) +
    geom_line() +
    theme_minimal() +
    labs(title = "Net Worth by year grouped by age groups",
         x = "Year",
         y = "Net Worth") + th

ggplotly(NW.plot, tooltip = "text") %>%
config(displayModeBar = FALSE)其他例子中使用ggplotly()都是直接照前面的方法套用即可。唯獨在Treemap中無法用這樣的方法來做互動的視覺化。想想這也正常,畢竟Treemap是用非ggplot的第三方套件(library(treemapify))。
除此之外,可以把R Markdown中Code Cell的的設定加入include=FALSE,這樣可以讓RMD在編製為HTML檔時,不要顯示程式碼,而直接顯示互動的視覺化介面。
31.1.2 SCATTER
bw <- read_csv("data/unicef-changing-childhood-data.csv") %>%
    select(country = WP5, age = WP22140, bw = WP22092) %>%
    mutate(country = ordered(country,
                             levels=c(1, 3, 4, 10, 11, 12, 13, 14, 17,
                                      29, 31, 33, 35, 36, 60, 61, 77,
                                      79, 81, 87, 165),
                             labels=c("USA", "Morocco", "Lebanon",
                                      "Indonesia","Bangladesh", "UK",
                                      "France", "Germany", "Spain",
                                      "Japan", "India", "Brazil",
                                      "Nigeria", "Kenya", "Ethiopia",
                                      "Mali", "Ukraine", "Cameroon",
                                      "Zimbabwe","Argentina", "Peru"))) %>%
    count(country, age, bw) %>%
    group_by(country, age) %>%
    mutate(perc = n/sum(n)) %>%
    ungroup() %>%
    filter(bw == 1) %>%
    select(country, age, perc) %>%
    spread(age, perc) %>%
rename(`15-24y` = `1`, `40+y` = `2`)31.1.3 Barplot
Bar charts with R (plotly.com)
county <- read_csv("data/tw_population_opendata110N010.csv") %>%
    slice(-1, -(370:375)) %>%
    type_convert() %>%
    mutate(county = str_sub(site_id, 1, 3)) %>%
    group_by(county) %>%
    summarize(
        area = sum(area),
        people_total = sum(people_total)
    ) %>%
    ungroup()

population.p <- county %>%
  mutate(county = reorder(county, people_total)) %>%
  ggplot() + aes(county, people_total) %>%
  geom_col(fill="skyblue") +
coord_flip() + th31.1.4 Boxplot
Box plots with ggplot2 (plotly.com)
aqi.toplot <- read_rds("https://github.com/p4css/R4CSS/raw/master/data/AQI_Chaozhou.rds") %>%
    arrange(日期)%>%
    filter(測項=="PM2.5") %>%
    gather("hour", "PM25", 4:28) %>%
    mutate(PM25 = as.numeric(PM25)) %>%
    drop_na() %>%
    mutate(year = lubridate::year(日期), month = lubridate::month(日期)) %>%
    filter(month %in% c(11, 12, 1, 2, 3))

aqi.plot <- aqi.toplot %>%
    mutate(year = as.character(year)) %>%
    ggplot() + aes(x=year, y=PM25)  +
    geom_boxplot(fill="skyblue", alpha=0.2) +
    ylim(0, 200) +
    coord_flip() +
theme_minimal()31.1.5 Treemap (Global Carbon)
其他例子中使用ggplotly()都是直接照前面的方法套用即可。唯獨在Treemap中無法用這樣的方法來做互動的視覺化。想想這也正常,畢竟Treemap是用非ggplot的第三方套件(library(treemapify))。
totreemap <- read_csv("data/GCB2021v34_MtCO2_flat.csv") %>%
    drop_na(`Total`) %>%
    filter(!Country %in% c("Global", "International Transport")) %>%
    filter(Year==2020) %>%
    arrange(desc(`Total`)) %>%
    mutate(perc = Total/sum(Total)) %>%
    slice(1:20)
library(treemapify)
carbon.p <- totreemap %>%
    ggplot() + aes(area = perc, fill=`Per Capita`, label=Country) +
    geom_treemap() +
    geom_treemap_text(color="white",
                      place="centre",
                      grow=TRUE
)31.2 產製圖表動畫
https://gist.github.com/rafapereirabr/0d68f7ccfc3af1680c4c8353cf9ab345
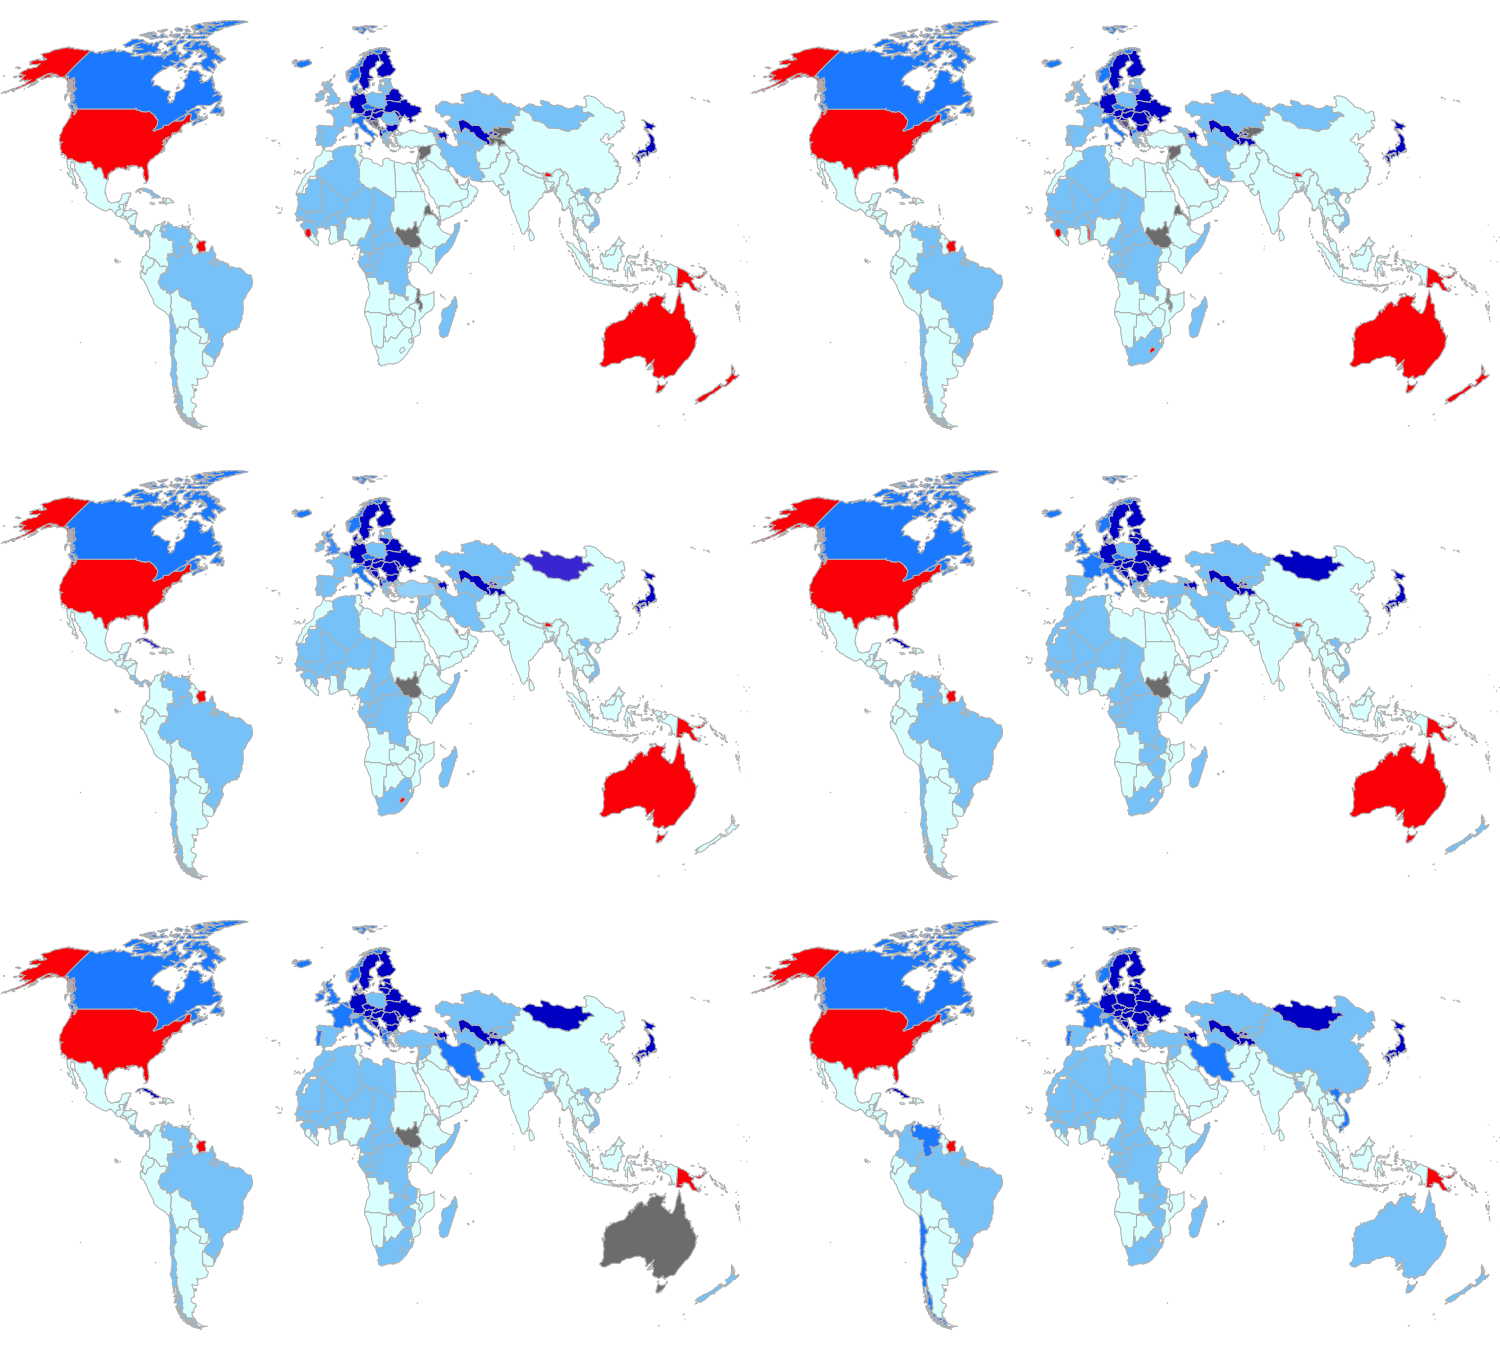
R也有套工具可以產製圖表動畫,概念上就是沿著一條資料維度,把多張圖給疊在一起變成一個gif動畫。本例子即是把產假之薪的範例沿著時間軸做動畫。每個時間點都是當年各國產假支薪給付程度的地圖,但由於有19年的資料,所以可以把年代當成動畫的時間軸。
以下是清理資料的步驟,會彙整出國名、國家代碼(ISO3)、年、和給付等級四個變項。預期利用國名、國家代碼和給付等級就可以畫出每年的圖。然後將年作為動畫的時間軸,便可產生地圖動畫。
pml <- read_excel("data/WORLD-MACHE_Gender_6.8.15.xls", "Sheet1", col_names=T) %>%
    select(country, iso3, contains("matleave"), -contains("wrr")) %>%
    gather("year", "degree", 3:21) %>%
    replace_na(list(degree=0)) %>%
    mutate(year2=as.POSIXct(strptime(year, "matleave_%y"))) %>%
    mutate(year3 = strftime(year2, "%Y")) %>%
    select(country, ISO3=iso3, year=year3, degree)
31.2.1 地圖下載與轉換投影方法
此為下載地圖並處理地圖成為可以用geom_polygom()繪圖的多邊形資料點。
library(rworldmap)
wmap <- getMap(resolution="low")
wmap <- spTransform(wmap, CRS("+proj=robin")) # reproject
wmap <- fortify(wmap)
wmap %>%
    filter(!duplicated(id)) %>% head(10)
## long lat order hole piece id
## 1 -6558139.1 1331765.9 1 FALSE 1 Aruba
## 2 6607120.5 3981587.8 1 FALSE 1 Afghanistan
## 3 1357824.3 -630231.6 1 FALSE 1 Angola
## 4 -5863722.7 1948851.8 1 FALSE 1 Anguilla
## 5 1723246.7 4546403.9 1 FALSE 1 Albania
## 6 1506389.0 6371182.0 1 FALSE 1 Aland
## 7 146562.7 4541753.0 1 FALSE 1 Andorra
## 8 5174600.6 2734691.9 1 FALSE 1 United Arab Emirates
## 9 -6057672.4 -2363055.4 1 FALSE 1 Argentina
## 10 3911094.7 4398155.0 1 FALSE 1 Armenia
## group
## 1 Aruba.1
## 2 Afghanistan.1
## 3 Angola.1
## 4 Anguilla.1
## 5 Albania.1
## 6 Aland.1
## 7 Andorra.1
## 8 United Arab Emirates.1
## 9 Argentina.1
## 10 Armenia.1pml_map <- wmap %>%
left_join(pml, by=c("id"="country")) %>%
filter(!is.na(ISO3)) %>%
mutate(year = as.integer(year))
# devtools::install_github("thomasp85/transformr")
pml_map %>%
select(id) %>%
filter(!duplicated(.)) %>% head(10)## id
## 1 Afghanistan
## 2 Angola
## 3 Albania
## 4 Andorra
## 5 United Arab Emirates
## 6 Argentina
## 7 Armenia
## 8 Antigua and Barbuda
## 9 Australia
## 10 Austria31.2.2 靜態繪圖測試
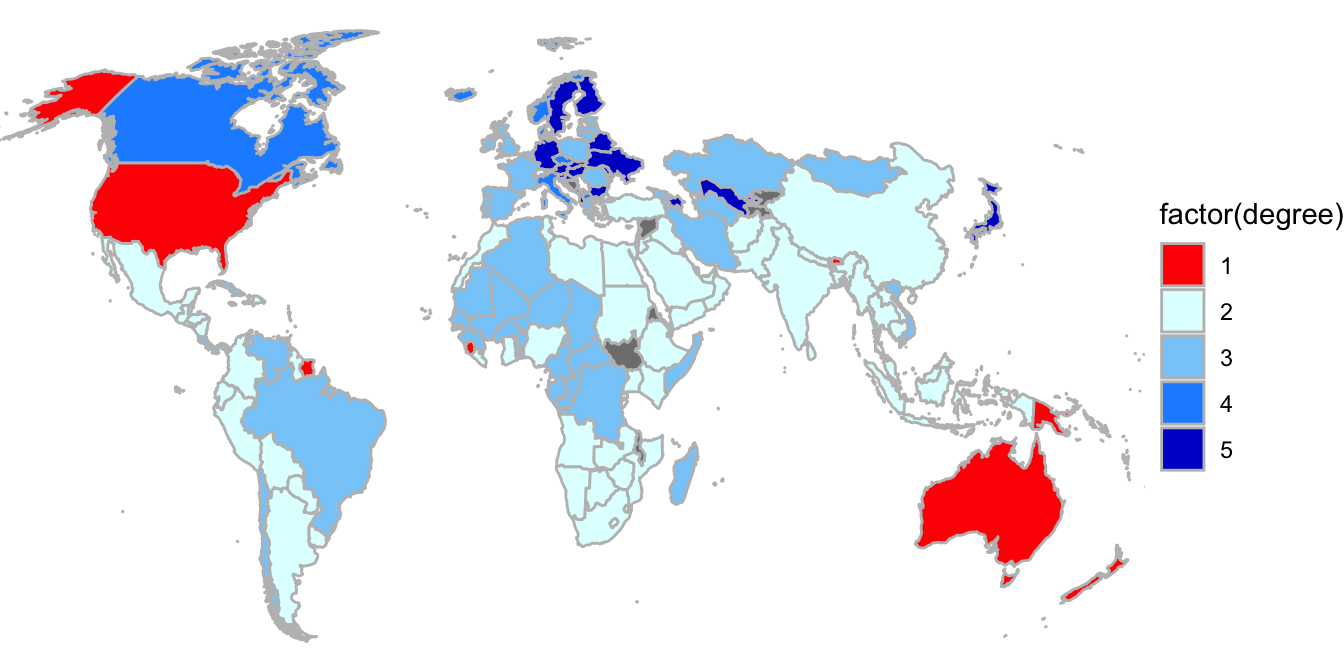
pml_map %>%
    filter(year==1995) %>%
    ggplot() +
    aes(x = long, y = lat,
                     group=group, fill=factor(degree)) +
    geom_polygon(color="grey") +
    theme_void() +
    scale_fill_manual(values=c("1"="red",
                               "2"="LightCyan",
                               "3"="lightskyblue",
                               "4"="DodgerBlue",
                               "5"="MediumBlue")) +
    coord_cartesian(xlim = c(-11807982, 14807978))
在採用gganimate繪圖時,僅需要多加一個動畫繪圖函式+ transition_time(year)即可,其他繪圖部分並無修改。最後才用animate()函式把這整個繪圖指令轉製為動畫,包含指定fps(frame per second)和長寬等參數。
library(gganimate)
pml.ani <- pml_map %>%
    ggplot() +
    aes(x = long, y = lat,
        group=group, fill=factor(degree)) +
    geom_polygon(color="grey") +
    theme_void() +
    scale_fill_manual(values=c("1"="red",
                               "2"="LightCyan",
                               "3"="lightskyblue",
                               "4"="DodgerBlue",
                               "5"="MediumBlue")) +
    coord_cartesian(xlim = c(-11807982, 14807978)) +
    transition_time(year)
# +
#     ease_aes("linear") +
#     enter_fade() +
#     exit_fade()

animate(pml.ani, fps = 10, end_pause = 30, width = 750, height = 450, renderer = gifski_renderer())
