Chapter 35 Case Studies (Taiwan)
35.1 TW AQI Visual Studies
## ── Attaching core tidyverse packages ──────────────────────── tidyverse 2.0.0 ──
## ✔ dplyr     1.1.4     ✔ readr     2.1.5
## ✔ forcats   1.0.0     ✔ stringr   1.5.1
## ✔ ggplot2   3.5.1     ✔ tibble    3.2.1
## ✔ lubridate 1.9.4     ✔ tidyr     1.3.1
## ✔ purrr     1.0.4
## ── Conflicts ────────────────────────────────────────── tidyverse_conflicts() ──
## ✖ dplyr::filter() masks stats::filter()
## ✖ dplyr::lag()    masks stats::lag()
## ℹ Use the conflicted package (<http://conflicted.r-lib.org/>) to force all conflicts to become errors35.1.2 Trending: Central tendency
toplot <- aqi_data %>%
    arrange(日期)%>%
    filter(測項=="PM2.5") %>%
    gather("hour", "PM25", 4:28) %>%
    mutate(PM25 = as.numeric(PM25)) %>%
    drop_na() %>%
    group_by(日期) %>%
    summarize(avg = mean(PM25)) %>%
    ungroup() %>%
    mutate(year = lubridate::year(日期),
           month = lubridate::month(日期)) %>%
    group_by(year, month) %>%
    summarize(avg = mean(avg)) %>%
    ungroup()
## Warning: There was 1 warning in `mutate()`.
## ℹ In argument: `PM25 = as.numeric(PM25)`.
## Caused by warning:
## ! NAs introduced by coercion## `summarise()` has grouped output by 'year'. You can override using the
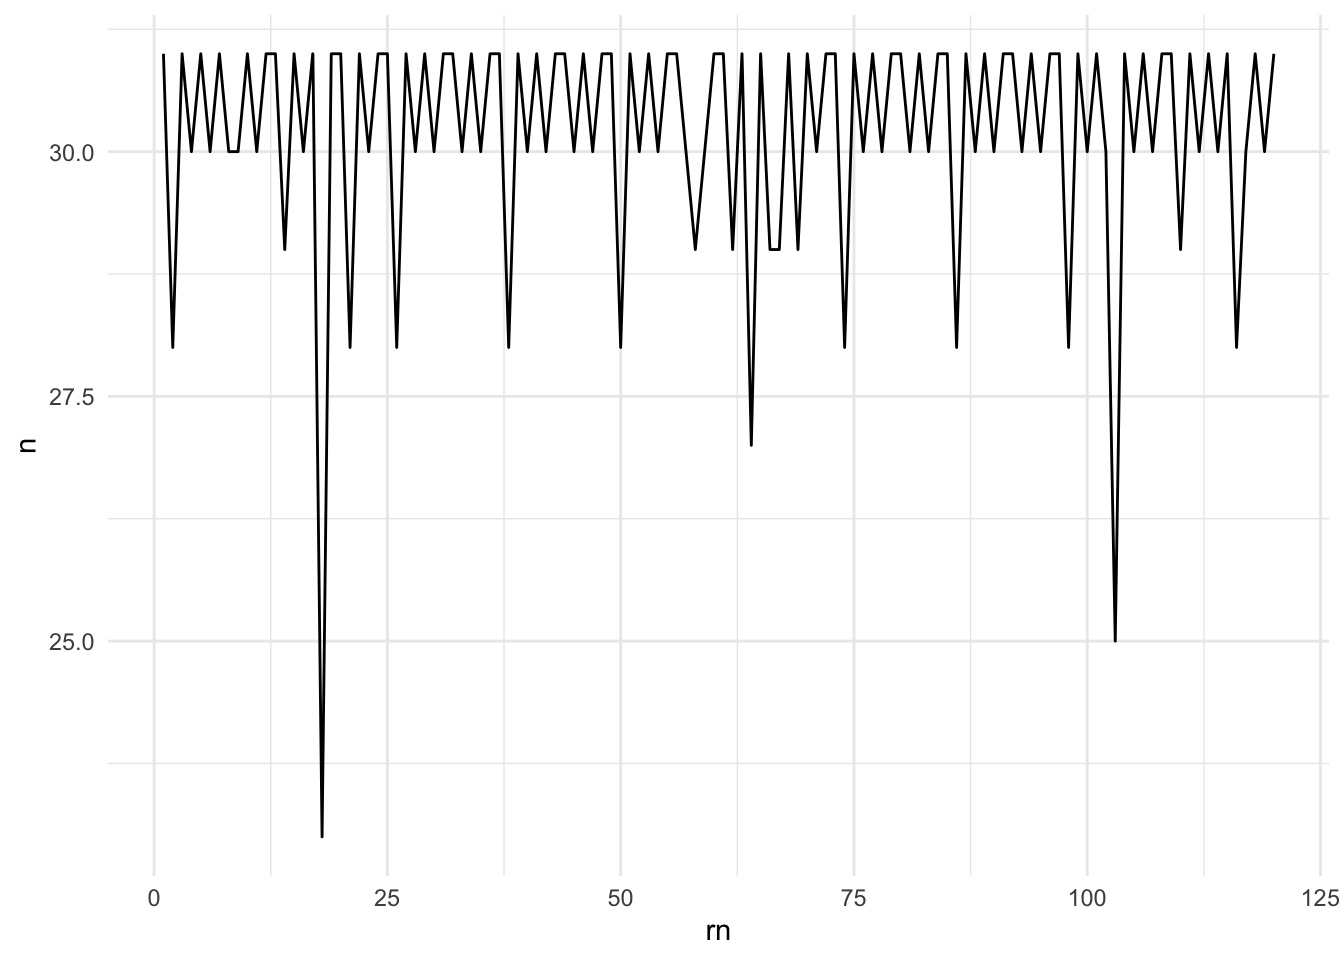
## `.groups` argument.Counting data by month and plotting to ensure the degree of data loss.
aqi_data %>%
    filter(測項=="PM2.5") %>%
    arrange(日期)%>%
    gather("hour", "PM25", 4:28) %>%
    mutate(PM25 = as.numeric(PM25)) %>%
    drop_na() %>%
    group_by(日期) %>%
    summarize(avg = mean(PM25)) %>%
    ungroup() %>%
    arrange(日期) %>%
    mutate(year = lubridate::year(日期),
           month = lubridate::month(日期)) %>%
    count(year, month) %>%
    mutate(rn = row_number()) %>%
    ggplot() + aes(rn, n) +
    geom_line() + theme_minimal()
## Warning: There was 1 warning in `mutate()`.
## ℹ In argument: `PM25 = as.numeric(PM25)`.
## Caused by warning:
## ! NAs introduced by coercion
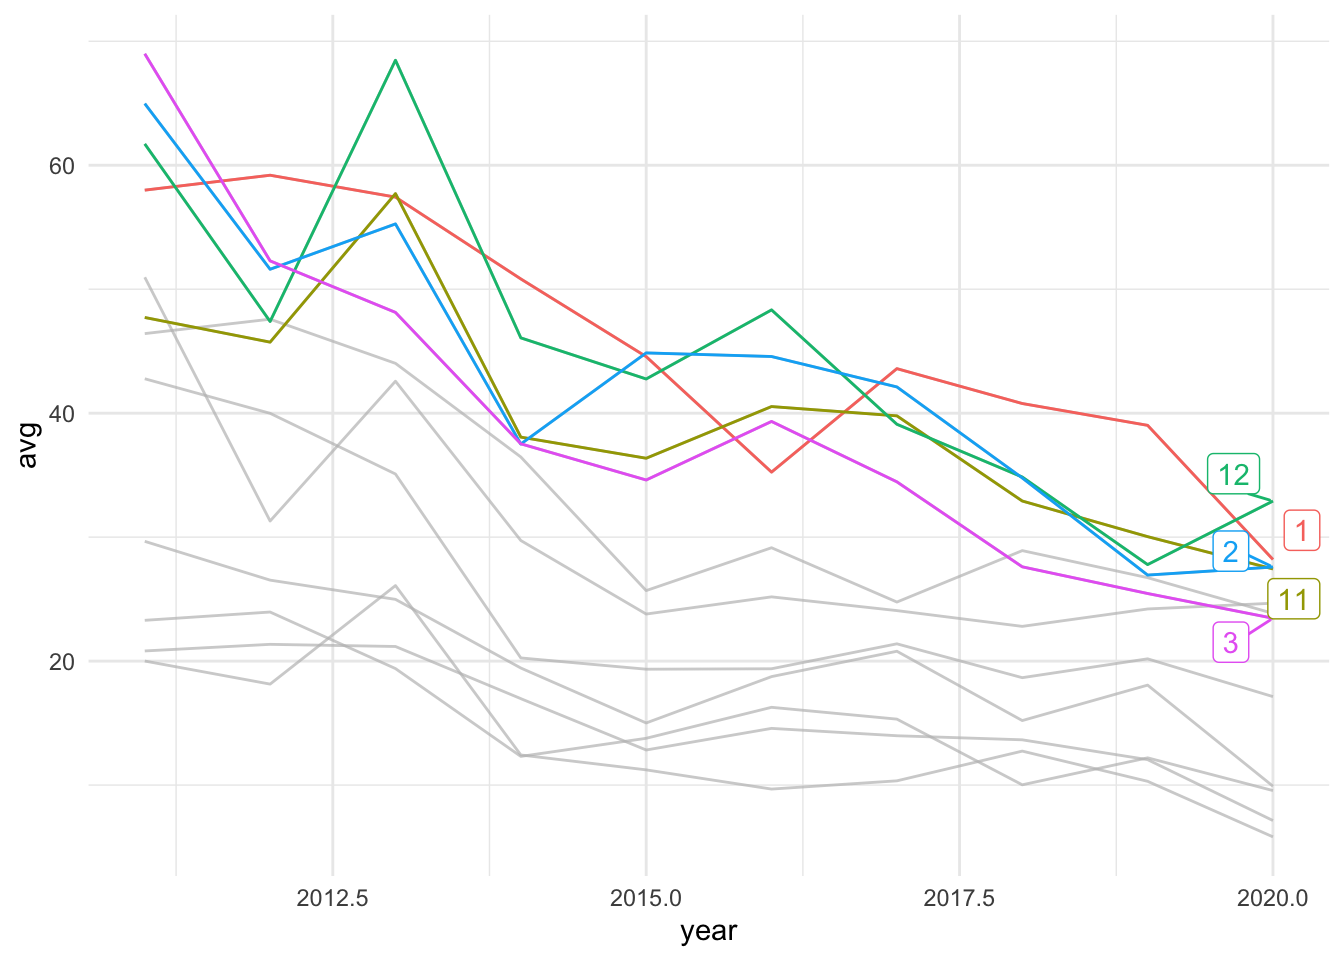
library(gghighlight)
toplot %>%
    mutate(month = as.character(month)) %>%
    group_by(month) %>%
    arrange(year) %>%
    # mutate(diff = avg -first(avg),
    #        month = as.character(month)) %>%
    # ungroup() %>%
    ggplot() + aes(year, avg, color = month) +
    geom_line() +
    # geom_point() +
    gghighlight(month %in% c("11", "12", "1", "2", "3")) +
    theme_minimal()
## Warning: Tried to calculate with group_by(), but the calculation failed.
## Falling back to ungrouped filter operation...## label_key: month
35.1.3 Trending: Extreme value
toplot2 <- aqi_data %>%
    arrange(日期)%>%
    filter(測項=="PM2.5") %>%
    gather("hour", "PM25", 4:28) %>%
    mutate(PM25 = as.numeric(PM25)) %>%
    drop_na() %>%
    group_by(日期) %>%
    summarize(avg = sum(PM25)/24) %>%
    ungroup() %>%
    mutate(year = lubridate::year(日期), month = lubridate::month(日期)) %>%
    group_by(year, month) %>%
    summarize(purple = sum(avg>150),
              red = sum(avg>54),
              orange = sum(avg>35)) %>%
    ungroup()
## Warning: There was 1 warning in `mutate()`.
## ℹ In argument: `PM25 = as.numeric(PM25)`.
## Caused by warning:
## ! NAs introduced by coercion## `summarise()` has grouped output by 'year'. You can override using the
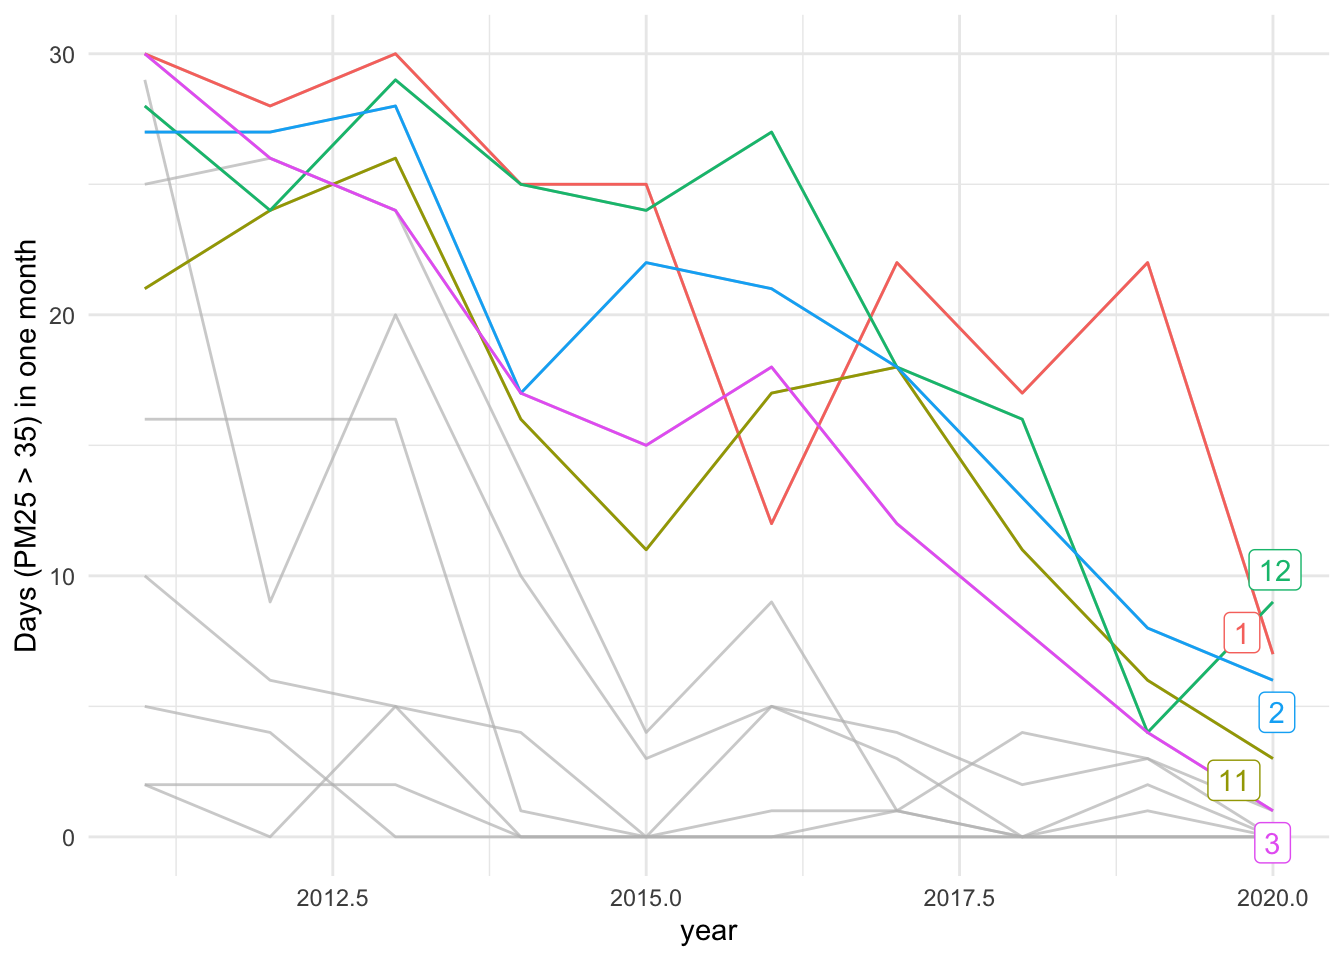
## `.groups` argument.toplot2 %>%
mutate(month = as.character(month)) %>%
group_by(month) %>%
arrange(year) %>%
ggplot() + aes(year, orange, color = month) +
geom_line() +
# geom_point() +
gghighlight(month %in% c("11", "12", "1", "2", "3")) +
ylab("Days (PM25 > 35) in one month") +
theme_minimal()## Warning: Tried to calculate with group_by(), but the calculation failed.
## Falling back to ungrouped filter operation...## label_key: month
toplot3 <- aqi_data %>%
    arrange(日期)%>%
    filter(測項=="PM2.5") %>%
    gather("hour", "PM25", 4:28) %>%
    mutate(PM25 = as.numeric(PM25)) %>%
    drop_na() %>%
    mutate(year = lubridate::year(日期), month = lubridate::month(日期)) %>%
    filter(month %in% c(11, 12, 1, 2, 3))
## Warning: There was 1 warning in `mutate()`.
## ℹ In argument: `PM25 = as.numeric(PM25)`.
## Caused by warning:
## ! NAs introduced by coerciontoplot3 %>%
mutate(year = as.character(year)) %>%
ggplot() + aes(y=year, x=PM25) +
geom_boxplot(fill="skyblue", alpha=0.2) +
xlim(0, 200) +
theme_minimal()