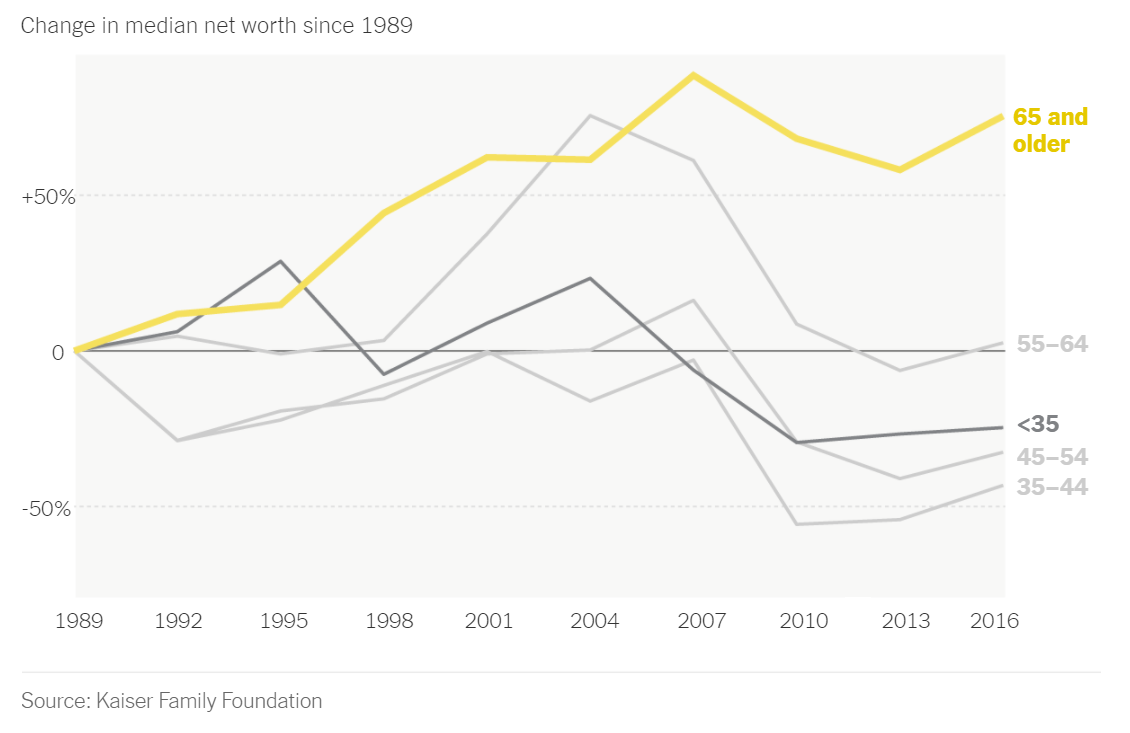
Chapter 33 Inequality: Net Worth by Age Group
LEARNING NOTES
座標軸從數值到增加值
這個教學案例來自紐約時報的「What’s going on in this gragh」系列資料視覺化教學之Teach About Inequality With These 28 New York Times Graphs - The New York Times (nytimes.com) 。該圖表呈現在不同年代、不同年齡層的人所擁有的淨資產(包含土地、存款、投資等減去債務)。該圖表的結果指出,在不同年代的老年人是越來越有錢,但年輕人卻越來越窮(該曲線為減去1989年
淨資產(Net worth)是一個財務術語,指的是一個人或機構的總資產減去總負債後剩餘的價值。換言之,Net worth是一個人或機構在財務上的價值或實力。如果一個人或機構的總資產超過了總負債,那麼其net worth為正值,反之則為負值。在個人財務上,Net worth通常用來評估一個人的財務健康狀況。一個人的Net worth越高,通常代表其擁有更多的財富和投資,並能夠更好地應對突發事件和生活變數。因此,許多投資者和財務顧問都會建議人們注重提高自己的net worth。
Sorted by arrange() function.
p1 <- read_csv("data/interactive_bulletin_charts_agecl_median.csv") %>%
    select(year, Category, Net_Worth) %>%
    group_by(Category) %>%
    arrange(year) %>%
    ungroup()
p1 %>% filter(year <= 1992) %>% knitr::kable()| year | Category | Net_Worth |
|---|---|---|
| 1989 | Less than 35 | 16.17019 |
| 1989 | 35-44 | 112.47530 |
| 1989 | 45-54 | 195.11630 |
| 1989 | 55-64 | 195.25554 |
| 1989 | 65-74 | 154.34277 |
| 1989 | 75 or older | 144.29855 |
| 1992 | Less than 35 | 16.60780 |
| 1992 | 35-44 | 79.91050 |
| 1992 | 45-54 | 139.97745 |
| 1992 | 55-64 | 203.44104 |
| 1992 | 65-74 | 176.44667 |
| 1992 | 75 or older | 155.35173 |
library(gghighlight)
p1 %>% ggplot() + aes(year, Net_Worth, color = Category) +
    geom_line(linetype="dotted") +
    geom_point() +
    gghighlight(Category %in% c("65-74", "35-44")) +
    theme_minimal() +
    scale_x_continuous(breaks = NULL) +
    theme(panel.background = element_rect(fill = "white",
                                colour = "white",
                                size = 0.5, linetype = "solid"))
p2 <- read_csv("data/interactive_bulletin_charts_agecl_median.csv") %>%
    select(year, Category, NW = Net_Worth)  %>%
    group_by(Category) %>%
    arrange(year) %>%
    mutate(increase = (NW-first(NW))/first(NW)) %>%
    ungroup()
p2 %>% filter(year <= 1992) %>% knitr::kable()| year | Category | NW | increase |
|---|---|---|---|
| 1989 | Less than 35 | 16.17019 | 0.0000000 |
| 1989 | 35-44 | 112.47530 | 0.0000000 |
| 1989 | 45-54 | 195.11630 | 0.0000000 |
| 1989 | 55-64 | 195.25554 | 0.0000000 |
| 1989 | 65-74 | 154.34277 | 0.0000000 |
| 1989 | 75 or older | 144.29855 | 0.0000000 |
| 1992 | Less than 35 | 16.60780 | 0.0270627 |
| 1992 | 35-44 | 79.91050 | -0.2895285 |
| 1992 | 45-54 | 139.97745 | -0.2825948 |
| 1992 | 55-64 | 203.44104 | 0.0419220 |
| 1992 | 65-74 | 176.44667 | 0.1432131 |
| 1992 | 75 or older | 155.35173 | 0.0765994 |
p2 %>% ggplot() + aes(year, increase, color = Category) +
    geom_line(linetype="dotted") +
    geom_point() +
    gghighlight(Category %in% c("65-74", "35-44")) +
    theme_minimal() +
    scale_y_continuous(labels=scales::parse_format()) +
    scale_x_continuous(breaks = NULL) +
    theme(panel.background = element_rect(fill = "white",
                                colour = "white",
                                size = 0.5, linetype = "solid"))
